Download the PHP package tracekit/laravel-apm without Composer
On this page you can find all versions of the php package tracekit/laravel-apm. It is possible to download/install these versions without Composer. Possible dependencies are resolved automatically.
Download tracekit/laravel-apm
More information about tracekit/laravel-apm
Files in tracekit/laravel-apm
Package laravel-apm
Short Description TraceKit APM for Laravel - Zero-config distributed tracing and code monitoring
License MIT
FAQ
Example:
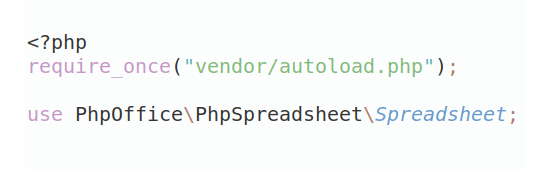
In general, it is recommended to use always a project to download your libraries. In an application normally there is more than one library needed.
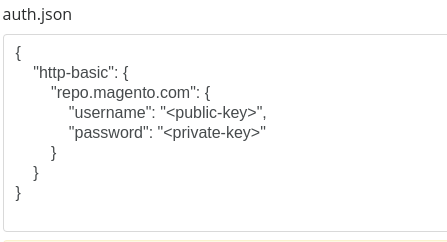
- Some hosting areas are not accessible by a terminal or SSH. Then it is not possible to use Composer.
- To use Composer is sometimes complicated. Especially for beginners.
- Composer needs much resources. Sometimes they are not available on a simple webspace.
- If you are using private repositories you don't need to share your credentials. You can set up everything on our site and then you provide a simple download link to your team member.
- Simplify your Composer build process. Use our own command line tool to download the vendor folder as binary. This makes your build process faster and you don't need to expose your credentials for private repositories.
Informations about the package laravel-apm
TraceKit APM for Laravel
Zero-config distributed tracing and performance monitoring for Laravel applications.


Features
- Zero Configuration - Works out of the box with sensible defaults
- Automatic Instrumentation - No code changes needed
- HTTP Request Tracing - Track every request, route, and middleware
- Database Query Monitoring - See every query with actual SQL and bindings
- Queue Job Tracking - Monitor Laravel jobs and queues
- Slow Query Detection - Automatically highlight slow database queries
- Error Tracking - Capture exceptions with full context
- Code Monitoring - Live debugging with breakpoints and variable inspection
- Metrics API - Counter, Gauge, and Histogram metrics with automatic OTLP export
- Low Overhead - < 5% performance impact
Installation
Quick Start
1. Install the package
2. Add your API key to .env
Get your API key at https://app.tracekit.dev
3. Done!
Your Laravel app is now automatically traced. Visit your TraceKit dashboard to see your traces.
Local Development
Debug your Laravel application locally without creating a cloud account using TraceKit Local UI.
Quick Start
The Local UI will start at http://localhost:9999 and automatically open in your browser.
How It Works
When running in local or development environment (Laravel's APP_ENV), the SDK automatically:
- Detects if Local UI is running at
http://localhost:9999 - Sends traces to both Local UI and cloud (if API key is present)
- Falls back gracefully if Local UI is not available
No code changes needed! Just set your .env:
Then run your app:
You'll see traces appear in real-time at http://localhost:9999.
Features
- Real-time trace viewing in your browser
- Works completely offline
- No cloud account required
- Zero configuration
- Automatic cleanup (1000 traces max, 1 hour retention)
Local-Only Development
To use Local UI without cloud sending:
Traces will only go to Local UI.
Disabling Local UI
To disable automatic Local UI detection:
Learn More
Configuration
Publish the configuration file:
This creates config/tracekit.php where you can customize:
Laravel 12 Setup
Laravel 12 changed how middleware is registered. TraceKit attempts to register middleware automatically for all Laravel versions (10, 11, and 12).
If automatic registration doesn't work, you can manually add the TraceKit middleware to your bootstrap/app.php:
For most cases, the automatic registration via the service provider should work without any manual configuration.
Configuration Options
Code Monitoring (Live Debugging)
TraceKit includes production-safe code monitoring for live debugging without redeployment.
Enable Code Monitoring
Add to your .env file:
Configuration Options:
enabled: Master switch for code monitoring (default:false)poll_interval: Background polling frequency in seconds (default:30)1= Every second (highest load, instant updates)5= Every 5 seconds (high load, very fast updates)10= Every 10 seconds (moderate load, fast updates)30= Every 30 seconds (recommended for production)60= Every minute (low load, slower updates)300+= Every 5+ minutes (very low load, periodic checks)
max_variable_depth: How deep to inspect nested structures (default:3)max_string_length: Maximum string length to capture (default:1000)
Add Debug Points
Add checkpoints anywhere in your code to capture variable state and stack traces:
Helper Functions
TraceKit provides convenient helper functions:
Automatic Breakpoint Management
- Auto-Registration: First call to
tracekit_snapshot()automatically creates breakpoints in TraceKit - Smart Matching: Breakpoints match by function name + label (stable across code changes)
- Background Sync: SDK polls for active breakpoints every 30 seconds
- Production Safe: No performance impact when breakpoints are inactive
What Gets Captured
Snapshots include:
- Variables: Local variables at capture point
- Stack Trace: Full call stack with file/line numbers
- Request Context: HTTP method, URL, headers, query params
- Execution Time: When the snapshot was captured
- Eloquent Models: Automatically serialized with relationships
Exception Handling
Exceptions are automatically captured when TRACEKIT_CODE_MONITORING_ENABLED=true - no additional code required!
The TraceKit service provider automatically registers an exception reporter that:
- Captures full stack traces with file and line numbers
- Records exception type, message, and context
- Includes HTTP request details (route, headers, params)
- Enables automatic code discovery for debugging
How It Works:
- Any uncaught exception is automatically reported to TraceKit
- Stack trace is formatted and attached to the current OpenTelemetry span
- Exception event includes
exception.stacktracefor code discovery - TraceKit backend parses stack traces and indexes your code locations
- Visit the "Browse Code" tab in
/snapshotsto see discovered code
PII Scrubbing
TraceKit Laravel SDK automatically scans snapshot variables for sensitive data before sending to the server. This ensures that passwords, API keys, and other credentials never leave your application.
How It Works
Sensitive data is detected in two ways:
- By variable name — Variables with sensitive names are redacted as
[REDACTED:sensitive_name] - By value pattern — Values matching known sensitive patterns are redacted as
[REDACTED:type]
Auto-Detected Sensitive Names
The SDK flags variables whose names contain any of the following (case-insensitive):
password, passwd, pwd, secret, token, key, credential, api_key, apikey
Name matching uses letter-based boundaries (not \b) so compound names like api_key, user_token, and db_password are correctly detected.
Auto-Detected Value Patterns
| Pattern | Example | Redacted As |
|---|---|---|
| Credit card numbers | 4111111111111111 |
[REDACTED:credit_card] |
| Email addresses | [email protected] |
[REDACTED:email] |
| Social Security Numbers | 123-45-6789 |
[REDACTED:ssn] |
| JWT tokens | eyJhbGciOiJIUzI1NiIs... |
[REDACTED:jwt] |
| AWS access keys | AKIAIOSFODNN7EXAMPLE |
[REDACTED:aws_key] |
| Stripe keys | sk_live_abc123... |
[REDACTED:stripe_key] |
| Private keys | -----BEGIN RSA PRIVATE KEY----- |
[REDACTED:private_key] |
Example
PII scrubbing is enabled by default and requires no configuration.
Kill Switch
TraceKit provides a server-side toggle to disable code monitoring per service without deploying code changes.
How It Works
When the kill switch is enabled for your service on the TraceKit dashboard (or via API), all snapshot captures are suppressed. No breakpoint data is sent.
Important: Laravel uses a per-request architecture (process-per-request), so kill switch state cannot be held in memory across requests. Instead, the SDK checks kill switch state via Laravel Cache on each request.
Controlling the Kill Switch
- Dashboard: Toggle code monitoring on/off per service in the TraceKit dashboard
- API:
POST /api/services/:name/kill-switchwith{"enabled": true}or{"enabled": false}
When disabled, code monitoring resumes automatically on the next poll cycle.
SSE Real-time Updates
Not applicable for Laravel's request lifecycle. Laravel processes each request in a separate PHP process, so persistent SSE connections are not feasible.
Instead, breakpoint updates are received via polling (default 30-second interval) and cached using Laravel's cache driver. This ensures breakpoint state is shared across all request processes.
Configure the poll interval in your .env:
Circuit Breaker
The circuit breaker protects your application if the TraceKit backend becomes unreachable.
How It Works
- The SDK tracks consecutive snapshot capture failures
- After 3 failures within 60 seconds, code monitoring is automatically paused
- After a 5-minute cooldown, the circuit breaker resets and captures resume
Behavior When Tripped
- All
tracekit_snapshot()calls become no-ops (zero overhead) - Distributed tracing and metrics continue to function normally
- The SDK automatically retries after the cooldown period
- No manual intervention required
Metrics
Track custom metrics using Counter, Gauge, and Histogram types. Metrics are automatically exported to TraceKit using the OTLP protocol.
Basic Usage
Counter
Counters track monotonically increasing values (requests, errors, items processed):
Gauge
Gauges track point-in-time values that can go up or down (active connections, queue size):
Histogram
Histograms track value distributions (request duration, payload sizes):
HTTP Request Metrics Example
Track HTTP request metrics in your routes:
Middleware Example
Track metrics across all routes using middleware:
Tags for Dimensional Analysis
Add tags to metrics for multi-dimensional analysis:
Common Use Cases
Database Metrics:
Queue Metrics:
Business Metrics:
Metric Export
Metrics are automatically buffered and exported to TraceKit:
- Buffer size: 100 metrics
- Export interval: 10 seconds
- Format: OTLP (OpenTelemetry Protocol)
Metrics are flushed automatically when the buffer is full or on application shutdown.
Automatic Service Discovery
TraceKit automatically instruments outgoing HTTP calls made with Laravel's HTTP client to create service dependency graphs.
How It Works
When your service makes an HTTP request using Laravel's Http facade:
- ✅ TraceKit creates a CLIENT span for the outgoing request
- ✅ Trace context is automatically injected into request headers (
traceparent) - ✅ The receiving service creates a SERVER span linked to your CLIENT span
- ✅ TraceKit maps the dependency: YourService → TargetService
Supported HTTP Clients
- ✅ Laravel HTTP Client (
Illuminate\Support\Facades\Http) - Automatic! - ✅ Guzzle (Laravel's HTTP client uses Guzzle under the hood)
Zero configuration required! Just use Laravel's HTTP client as normal:
Service Name Detection
TraceKit intelligently extracts service names from URLs:
| URL | Extracted Service Name |
|---|---|
http://payment-service:3000 |
payment-service |
http://payment.internal |
payment |
http://payment.svc.cluster.local |
payment |
https://api.example.com |
api.example.com |
This works seamlessly with:
- Kubernetes service names
- Internal DNS names
- Docker Compose service names
- External APIs
Custom Service Name Mappings
For local development or when service names can't be inferred from hostnames, add service_name_mappings to your config/tracekit.php:
Then make HTTP calls as normal:
This is especially useful when:
- Running microservices locally on different ports
- Using Docker Compose with localhost networking
- Testing distributed tracing in development
Example: Multi-Service Application
Viewing Service Dependencies
Visit your TraceKit dashboard to see:
- Service Map: Visual graph showing which services call which
- Service List: Table of all services with health metrics
- Service Detail: Deep dive on individual services with upstream/downstream dependencies
Disabling Auto-Instrumentation
Add to your .env file:
Or in config/tracekit.php:
What Gets Traced?
Incoming HTTP Requests (SERVER spans)
Every HTTP request to your Laravel app is automatically traced with:
- Route name and URI
- HTTP method and status code
- Request duration
- User agent and client IP
- Query parameters
- Response size
Outgoing HTTP Requests (CLIENT spans)
Every HTTP request from your Laravel app is automatically traced with:
- Target URL and HTTP method
- HTTP status code
- Request duration
peer.serviceattribute for service dependency mapping
Database Queries
All database queries are traced with:
- Actual SQL with bound parameters
- Query duration
- Slow query highlighting (configurable threshold)
- Connection name and database
Queue Jobs
Laravel queue jobs are traced with:
- Job class name
- Queue name and connection
- Job status (completed/failed)
- Execution time
- Failure reasons and exceptions
Errors and Exceptions
All exceptions are automatically captured with:
- Exception type and message
- Full stack trace
- Request context
- User information
Coming Soon
The following features are planned for future releases:
- Cache Operations - Redis, Memcached, and file cache tracing
- Redis Commands - Direct Redis command tracing
- External HTTP Calls - Outgoing HTTP request tracking
Advanced Usage
Manual Tracing
You can create custom traces in your code:
Environment-Based Configuration
Disable tracing in local development:
Enable only specific features:
Sampling
Trace only a percentage of requests (e.g., 10%):
Performance
TraceKit APM is designed to have minimal performance impact:
- < 5% overhead on average request time
- Asynchronous trace sending (doesn't block responses)
- Automatic batching and compression
- Configurable sampling for high-traffic apps
Security
- Sensitive data handling: Query bindings can be disabled
- Secure transmission: HTTPS only
- API key authentication
- No PII collected by default
Disable query bindings:
Requirements
- PHP 8.1 or higher
- Laravel 10.x, 11.x, or 12.x
Support
- Documentation: https://app.tracekit.dev/docs
- Issues: https://github.com/Tracekit-Dev/laravel-apm/issues
- Email: [email protected]
License
MIT License. See LICENSE for details.
Credits
Built with ❤️ by the TraceKit team.
All versions of laravel-apm with dependencies

illuminate/support Version ^10.0|^11.0|^12.0
illuminate/database Version ^10.0|^11.0|^12.0
illuminate/cache Version ^10.0|^11.0|^12.0
guzzlehttp/guzzle Version ^7.0
open-telemetry/sdk Version ^1.0
open-telemetry/exporter-otlp Version ^1.0
open-telemetry/api Version ^1.0
tracekit/php-apm Version ^1.2.2