Download the PHP package stackwatch/laravel without Composer
On this page you can find all versions of the php package stackwatch/laravel. It is possible to download/install these versions without Composer. Possible dependencies are resolved automatically.
Download stackwatch/laravel
More information about stackwatch/laravel
Files in stackwatch/laravel
Package laravel
Short Description StackWatch Laravel SDK - AI-powered application monitoring for Laravel
License MIT
Homepage https://stackwatch.dev
FAQ
Example:
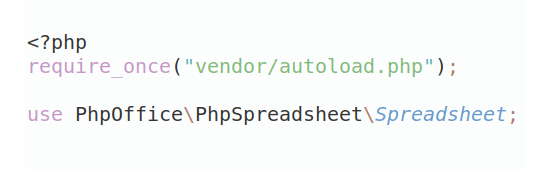
In general, it is recommended to use always a project to download your libraries. In an application normally there is more than one library needed.
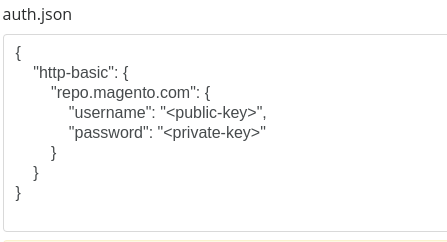
- Some hosting areas are not accessible by a terminal or SSH. Then it is not possible to use Composer.
- To use Composer is sometimes complicated. Especially for beginners.
- Composer needs much resources. Sometimes they are not available on a simple webspace.
- If you are using private repositories you don't need to share your credentials. You can set up everything on our site and then you provide a simple download link to your team member.
- Simplify your Composer build process. Use our own command line tool to download the vendor folder as binary. This makes your build process faster and you don't need to expose your credentials for private repositories.
Informations about the package laravel
StackWatch Laravel SDK
AI-powered application monitoring for Laravel applications.


🤖 AI-Assisted Installation (For Vibe Coders)
Using an AI coding assistant like GitHub Copilot, Cursor, Claude, or ChatGPT? Copy and paste the prompt below to have your AI handle the entire setup:
Copy This Entire Prompt
Features
- 🔴 Error Tracking - Automatic exception capture with full stack traces
- 🤖 AI Analysis - Get AI-powered insights and fix suggestions
- ⚡ Performance Monitoring - Track response times and slow queries
- 🍞 Breadcrumbs - Automatic logging of events leading up to errors
- 👤 User Context - Automatically capture authenticated user info
- 📝 Log Integration - Capture all Laravel logs (debug, info, warning, error)
- 💾 Backup Monitoring - Spatie Laravel Backup integration
- 🏥 Health Checks - Spatie Laravel Health integration
- 📊 Activity Logging - Spatie Activity Log integration
- 🔔 Notifications - Get alerted via Slack, Discord, or email
- ⏱️ Rate Limiting - Smart rate limiting with event buffering
Requirements
- PHP 8.0+
- Laravel 8.x, 9.x, 10.x, 11.x, or 12.x
Installation
Quick Install (Recommended)
The install command will guide you through:
- Publishing the configuration
- Setting up your API key
- Testing the connection
Manual Install
Add to .env:
Test your installation:
Usage
Automatic Exception Capture
Exceptions are automatically captured and sent to StackWatch. No additional code needed!
Manual Exception Reporting
Capture Messages
Capture Custom Events
Add Custom Context
Add Breadcrumbs
Log Integration
StackWatch captures every Laravel log automatically through the MessageLogged
event - whatever channel it is written to - so no logging configuration is
required. Tune it with:
Each log is sent once. Reported exceptions are sent once as well: the log
line Laravel writes for an exception that was already captured by the exception
handler is skipped, and Log::error('...', ['exception' => $e]) produces a
single exception event (with stack trace) instead of a plain log event.
Optional: the stackwatch log channel
The package also registers a stackwatch log channel. STACKWATCH_AUTO_REGISTER_LOG=true
adds it to your stack, or add it manually in config/logging.php. It is kept
for backwards compatibility - while automatic log capture is active the channel
is a no-op, so it never duplicates events.
Log Sampling
To reduce volume for high-traffic applications:
Long Messages
The API accepts messages up to 25000 characters. Longer log/message/custom
event messages are automatically split into several [part 1/3] …,
[part 2/3] … events that share a context.message_part.group id, so nothing
is lost or rejected. Exception messages are truncated instead (an exception
stays a single event). The limit can be lowered:
Middleware
Add the middleware to capture request context and performance data:
Integrations
Spatie Laravel Backup
Automatically monitors your backups when spatie/laravel-backup is installed.
Events captured:
- ✅ Backup successful
- ❌ Backup failed
- 🧹 Cleanup successful/failed
- 🏥 Backup health checks
To disable:
Spatie Laravel Health
Monitors health checks when spatie/laravel-health is installed.
Only failed or warning health checks are sent to reduce noise.
To disable:
Spatie Activity Log
Captures activity logs when spatie/laravel-activitylog is installed.
Filter by log name or event type in config/stackwatch.php:
Ignored Exceptions
By default, StackWatch ignores common exceptions that are not actual errors:
NotFoundHttpException(404 errors)ModelNotFoundException(404 for missing models)AuthenticationException(401 errors)AuthorizationException(403 errors)ValidationException(422 validation errors)TokenMismatchException(CSRF errors)
To customize ignored exceptions, modify config/stackwatch.php:
To report all exceptions (including 404s):
Rate Limiting
StackWatch includes smart rate limiting to prevent overwhelming the API:
When rate limited, events are automatically buffered and sent with the next successful request. No events are lost!
To disable buffering (drop events when rate limited):
Performance Monitoring
Performance monitoring is enabled by default with smart defaults to minimize overhead:
Transaction Grouping
Configure how requests are grouped for aggregation:
Aggregation (Default)
Instead of sending every request, StackWatch aggregates metrics and sends summaries:
- Collects requests until batch size reached (default: 50)
- Sends aggregated stats: avg/min/max duration, error rate, request count
- Time-based flush: after interval passes AND minimum count reached
- Prevents sending useless aggregates with only 1-2 requests
Slow Requests
Requests slower than the threshold are always sent immediately (not aggregated):
Sampling (When Aggregation Disabled)
If aggregation is disabled, sampling controls how many requests are sent:
Disable Performance Monitoring
Deployment Notifications
Notify StackWatch when you deploy:
Or in your CI/CD pipeline:
Environment Variables
| Variable | Description | Default |
|---|---|---|
STACKWATCH_API_KEY |
Your API key (required) | - |
STACKWATCH_ENDPOINT |
API endpoint | https://api.stackwatch.dev/v1 |
STACKWATCH_ENVIRONMENT |
Environment name | APP_ENV |
STACKWATCH_RELEASE |
Release version | APP_VERSION |
STACKWATCH_ENABLED |
Enable/disable | true |
STACKWATCH_CAPTURE_EXCEPTIONS |
Auto-capture exceptions | true |
STACKWATCH_LOG_LEVEL |
Minimum log level | debug |
STACKWATCH_CAPTURE_LOGS_AS_EVENTS |
Send logs as events | true |
STACKWATCH_AUTO_REGISTER_LOG |
Add the stackwatch channel to the log stack (optional - logs are captured automatically) |
false |
STACKWATCH_LOG_SAMPLE_RATE |
Log sampling rate (0-1) | 1.0 |
STACKWATCH_MAX_MESSAGE_LENGTH |
Max message length; longer messages are split | 25000 |
STACKWATCH_RATE_LIMIT_PER_MINUTE |
Rate limit | 60 |
STACKWATCH_PERFORMANCE_ENABLED |
Performance monitoring | true |
STACKWATCH_PERFORMANCE_GROUP_BY |
Group by 'path' or 'route' | path |
STACKWATCH_PERFORMANCE_SAMPLE_RATE |
Performance sampling (when aggregation disabled) | 0.1 |
STACKWATCH_PERFORMANCE_AGGREGATE |
Aggregate performance metrics | true |
STACKWATCH_PERFORMANCE_BATCH_SIZE |
Requests before sending aggregate | 50 |
STACKWATCH_PERFORMANCE_FLUSH_INTERVAL |
Seconds before time-based flush | 60 |
STACKWATCH_PERFORMANCE_MIN_FLUSH_COUNT |
Min requests for time-based flush | 5 |
STACKWATCH_SLOW_REQUEST_THRESHOLD |
Slow request threshold (ms) | 3000 |
STACKWATCH_SPATIE_BACKUP_ENABLED |
Backup integration | true |
STACKWATCH_SPATIE_HEALTH_ENABLED |
Health integration | true |
STACKWATCH_SPATIE_ACTIVITYLOG_ENABLED |
Activity log integration | true |
STACKWATCH_FLOOD_PROTECTION |
Enable flood protection | true |
STACKWATCH_FLOOD_DUPLICATE_WINDOW |
Duplicate detection window (seconds) | 60 |
STACKWATCH_FLOOD_MAX_DUPLICATES |
Max same message per window | 5 |
STACKWATCH_CIRCUIT_BREAKER |
Enable circuit breaker | true |
STACKWATCH_CIRCUIT_BREAKER_THRESHOLD |
Logs to trip breaker | 100 |
STACKWATCH_CIRCUIT_BREAKER_WINDOW |
Circuit breaker window (seconds) | 10 |
STACKWATCH_CIRCUIT_BREAKER_COOLDOWN |
Cooldown after trip (seconds) | 30 |
Flood Protection
StackWatch includes built-in flood protection to prevent log storms from crashing your application or creating massive log files.
How It Works
-
Duplicate Detection: Same log message can only be sent 5 times per minute (configurable). Messages are normalized to ignore dynamic parts like UUIDs, timestamps, and IPs.
- Circuit Breaker: If 100+ logs occur within 10 seconds, the circuit breaker trips and blocks all logs for 30 seconds. This prevents infinite loops from overwhelming your system.
Configuration
Manual Control
Artisan Commands
StackWatch provides several Artisan commands for managing monitoring:
Test Connection
Deployment Tracking
Performance Buffer Management
Performance metrics are aggregated in a buffer before being sent. You can manage this buffer:
Example output:
Note: The performance buffer is stored in storage/stackwatch/ directory. Make sure this directory is writable by your web server. You may want to add storage/stackwatch/ to your .gitignore.
Troubleshooting
Events not appearing
-
Check your API key:
- Check for rate limiting:
High memory usage
Reduce breadcrumb count:
Too many events
Use sampling:
Testing
Changelog
Please see CHANGELOG for more information on what has changed recently.
Contributing
Please see CONTRIBUTING for details.
Security
If you discover any security-related issues, please email [email protected] instead of using the issue tracker.
License
The MIT License (MIT). Please see License File for more information.
All versions of laravel with dependencies

illuminate/support Version ^8.0|^9.0|^10.0|^11.0|^12.0
illuminate/http Version ^8.0|^9.0|^10.0|^11.0|^12.0
illuminate/cache Version ^8.0|^9.0|^10.0|^11.0|^12.0
guzzlehttp/guzzle Version ^7.0