Download the PHP package tuupola/instrument without Composer
On this page you can find all versions of the php package tuupola/instrument. It is possible to download/install these versions without Composer. Possible dependencies are resolved automatically.
Download tuupola/instrument
More information about tuupola/instrument
Files in tuupola/instrument
Package instrument
Short Description Application metrics toolbox for InfluxDB
License MIT
Homepage https://github.com/tuupola/instrument
FAQ
Example:
In general, it is recommended to use always a project to download your libraries. In an application normally there is more than one library needed.
- Some hosting areas are not accessible by a terminal or SSH. Then it is not possible to use Composer.
- To use Composer is sometimes complicated. Especially for beginners.
- Composer needs much resources. Sometimes they are not available on a simple webspace.
- If you are using private repositories you don't need to share your credentials. You can set up everything on our site and then you provide a simple download link to your team member.
- Simplify your Composer build process. Use our own command line tool to download the vendor folder as binary. This makes your build process faster and you don't need to expose your credentials for private repositories.
Informations about the package instrument
Instrument


With Instrument you can monitor and measure your PHP application performance. It can collect and store metrics such as script execution time and memory usage or time spent in database.

Usage
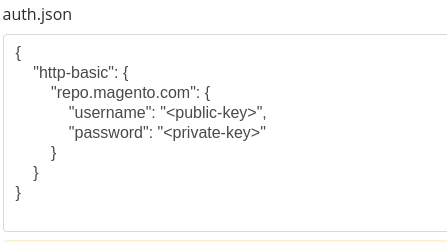
Install using composer.
You also must have access to InfluxDB database to store the data. After installing connect to your database and start sending metrics.
Optionally if you want to use the gauge datatype you need the shmop extension and klaussilveira/simple-shm library.
There is also a companion middleware which can automate basic instrumenting of application code if you are using PSR-7 based framework.
Demo
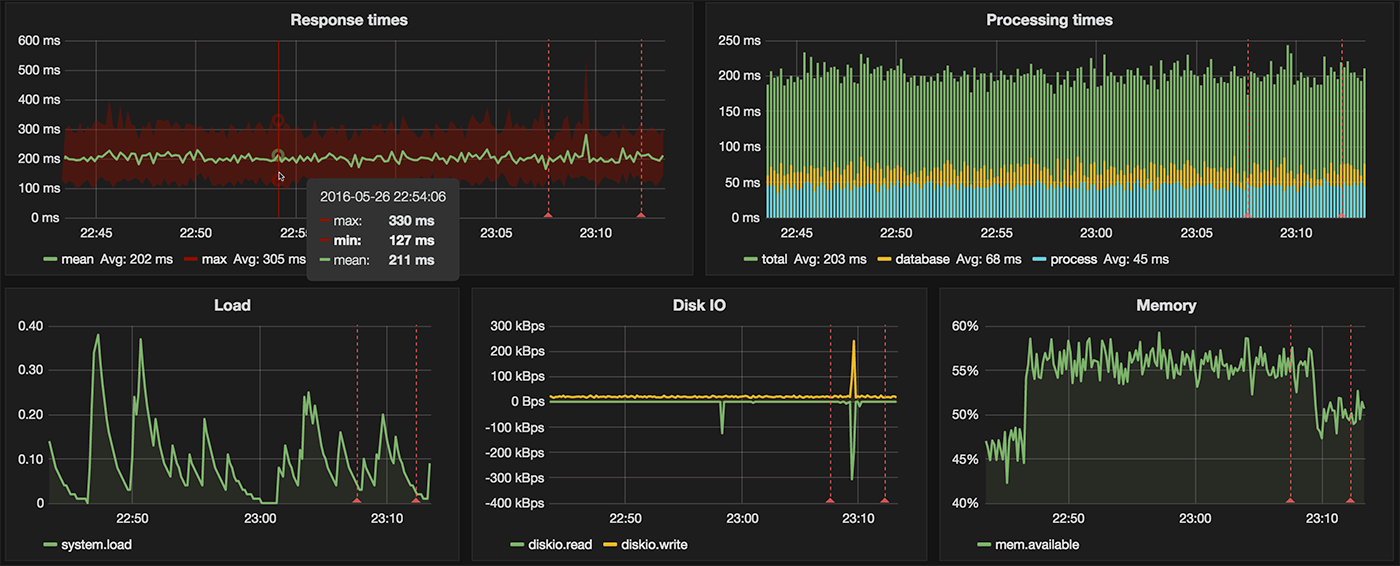
Example Grafana dashboard is included. To see Instrument in action start the Vagrant demo server and make some example requests.
The above commands start the server and inserts random Instrument data every second. You can now access the provided demo dashboard (admin:admin) to see this happening live.
Writing data
Documentation assumes you have working knowledge of InfluxDB data structures. Each measurement must have a name. Measurements should contain either one value or several value fields or both. Optionally measurement can have one or more tags.
For example to create a new count measurement with name users with one value of 100 use either of the following.
To log several values and additionally tag the measurement.
The event datatype does not contain numerical measurements.
Datatypes
Count
Count is the simplest datatype. In addition to setting the value you can also increment and decrement it.
Or if you prefer fluent interfaces you can also do the following.
Timing
With timing you can measure execution time in milliseconds. You can either pass the value yourself or use the provided helpers to measure code execution time.
Since timing internally uses symfony/stopwatch you can get PHP memory usage as a bonus. It is not automatically included in the measurement data, but you can include it manually.
Gauge
Gauge is same as count. However it remembers the value between requests. Gauge values are zeroed when server restarts. You need the shmop extension and klaussilveira/simple-shm to be able to use gauges.
Single value can be deleted from shared memory with delete() method. All values of the named gauge can be deleted at once with clear() method.
Event
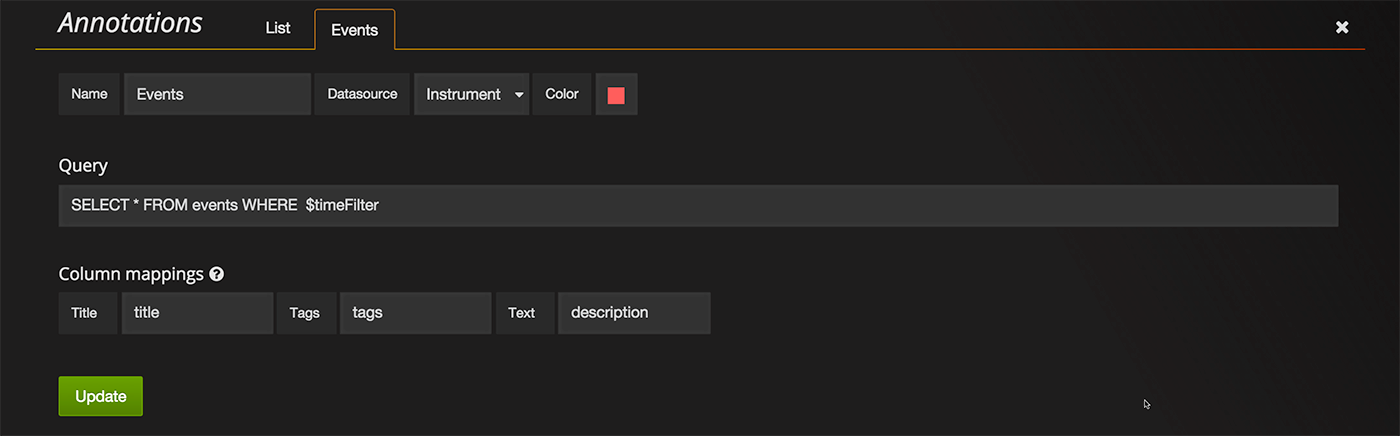
Events can be used to display annotations in your dashboard. By default they do not contain numerical measurements. Instead it contains title and description fields. These should contain a short name and longer description for the event.
If you are using Grafana you can use above data by using SELECT * FROM events WHERE $timeFilter as the annotation query. Also set the column mappings as shown below.
Testing
You can run tests either manually...
... or automatically on every code change. This requires entr to work.
Contributing
Please see CONTRIBUTING for details.
Security
If you discover any security related issues, please email [email protected] instead of using the issue tracker.
License
The MIT License (MIT). Please see License File for more information.
All versions of instrument with dependencies

influxdb/influxdb-php Version ^1.2
symfony/stopwatch Version ^3.0|^4.0|^5.0