Download the PHP package sourcentis/chartjs-gauge without Composer
On this page you can find all versions of the php package sourcentis/chartjs-gauge. It is possible to download/install these versions without Composer. Possible dependencies are resolved automatically.
Download sourcentis/chartjs-gauge
More information about sourcentis/chartjs-gauge
Files in sourcentis/chartjs-gauge
Package chartjs-gauge
Short Description A Chart.js plugin providing a gauge chart type with needle and value label
License MIT
Homepage https://github.com/sourcentis/chartjs-gauge
FAQ
Example:
In general, it is recommended to use always a project to download your libraries. In an application normally there is more than one library needed.
- Some hosting areas are not accessible by a terminal or SSH. Then it is not possible to use Composer.
- To use Composer is sometimes complicated. Especially for beginners.
- Composer needs much resources. Sometimes they are not available on a simple webspace.
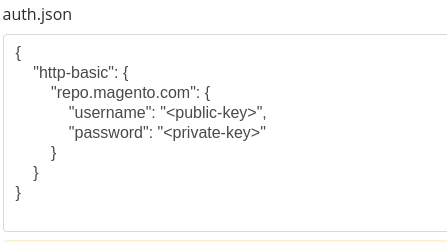
- If you are using private repositories you don't need to share your credentials. You can set up everything on our site and then you provide a simple download link to your team member.
- Simplify your Composer build process. Use our own command line tool to download the vendor folder as binary. This makes your build process faster and you don't need to expose your credentials for private repositories.
Informations about the package chartjs-gauge
@sourcentis/chartjs-gauge
A Chart.js plugin that adds a gauge chart type — a half-doughnut with an animated needle and a configurable value label.


Features
- Gauge chart type (
type: 'gauge') built on Chart.js's doughnut controller - Animated needle with configurable radius, width, length, and color
- Value label with custom formatter, background, border-radius, padding, and color
- Supports
minValueto offset the gauge starting point - Compatible with Chart.js v4
- Works as a Laravel Composer package (publishes pre-built assets) or a standalone npm package
Installation
npm / yarn
Composer (Laravel)
Then publish the pre-built assets:
This copies the dist/ files to public/vendor/chartjs-gauge/.
Quick Start
ES module (Vite / webpack)
CDN (UMD)
Dataset Properties
| Property | Type | Default | Description |
|---|---|---|---|
value |
number |
— | Required. Current needle position. |
minValue |
number |
0 |
Minimum gauge value (offset starting point). |
data |
number[] |
— | Required. Segment boundary values (cumulative). |
backgroundColor |
string[] |
— | Colors for each segment. |
Segments vs. value
data defines the segment boundaries on the gauge arc. The value property controls where the needle points independently of the segments.
Using minValue
Options
Needle
Configure via options.needle:
| Option | Type | Default | Description |
|---|---|---|---|
radiusPercentage |
number |
2 |
Needle pivot circle radius as % of chart width. |
widthPercentage |
number |
3.2 |
Needle base width as % of chart width. |
lengthPercentage |
number |
80 |
Needle length as % of the arc depth (inner→outer radius). |
color |
string |
"rgba(0, 0, 0, 1)" |
Needle and pivot circle fill color. |
Value Label
Configure via options.valueLabel:
| Option | Type | Default | Description |
|---|---|---|---|
display |
boolean |
true |
Show or hide the label. |
formatter |
function |
(v) => String(v) |
Format the displayed value. Receives the raw value. |
fontSize |
number |
12 |
Font size in pixels. |
color |
string |
"rgba(255, 255, 255, 1)" |
Text color. |
backgroundColor |
string |
"rgba(0, 0, 0, 0.8)" |
Background fill color. |
borderRadius |
number |
5 |
Background corner radius in pixels. |
padding |
object |
{top:5,right:10,bottom:5,left:10} |
Inner padding around the label text. |
bottomMarginPercentage |
number |
5 |
Vertical offset from gauge center as % of chart width. |
Formatter examples
Arc (inherited from Doughnut)
The gauge arc is a 180° half-doughnut by default. You can override these Chart.js options:
| Option | Default | Description |
|---|---|---|
rotation |
-90 |
Start angle in degrees. |
circumference |
180 |
Arc span in degrees. |
cutout |
"50%" |
Inner radius as % of outer radius. |
Examples
Maturity score (0–100, three zones)
Full-circle gauge (360°)
With Chart.js datalabels plugin
Laravel / Vite Integration
If you use this package via Composer and build assets with Vite, add an alias in vite.config.mjs:
Then import normally in your JS:
API
Named export
Default export
Browser Support
Same as Chart.js v4 — all modern browsers (Chrome, Firefox, Safari, Edge).
Contributing
- Clone the repo
npm installnpm run dev— watch modenpm run build— production build
License
Sourcentis
Acknowledgements
Inspired by chartjs-gauge by haiiaaa.