Download the PHP package sj-i/php-profiler without Composer

On this page you can find all versions of the php package sj-i/php-profiler. It is possible to download/install these versions without Composer. Possible dependencies are resolved automatically.

FAQ

After the download, you have to make one include require_once('vendor/autoload.php');. After that you have to import the classes with use statements.

Example:
If you use only one package a project is not needed. But if you use more then one package, without a project it is not possible to import the classes with use statements.

In general, it is recommended to use always a project to download your libraries. In an application normally there is more than one library needed.
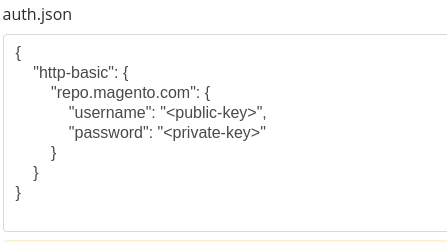
Some PHP packages are not free to download and because of that hosted in private repositories. In this case some credentials are needed to access such packages. Please use the auth.json textarea to insert credentials, if a package is coming from a private repository. You can look here for more information.

  • Some hosting areas are not accessible by a terminal or SSH. Then it is not possible to use Composer.
  • To use Composer is sometimes complicated. Especially for beginners.
  • Composer needs much resources. Sometimes they are not available on a simple webspace.
  • If you are using private repositories you don't need to share your credentials. You can set up everything on our site and then you provide a simple download link to your team member.
  • Simplify your Composer build process. Use our own command line tool to download the vendor folder as binary. This makes your build process faster and you don't need to expose your credentials for private repositories.
Please rate this library. Is it a good library?

Informations about the package php-profiler

Reli

Minimum PHP version: 8.1.0 Packagist Github Actions Scrutinizer Code Quality Coverage Status Psalm coverage

Reli is a sampling profiler (or a VM state inspector) written in PHP. It can read information about running PHP script from outside of the process. It's a stand alone CLI tool, so target programs don't need any modifications. The former name of this tool was sj-i/php-profiler.

What can I use this for?

How it works

It's implemented by using following techniques:

If you have a bit of extra CPU resource, the overhead of this software would be negligible.

Differences to phpspy, when to use reli

Reli is heavily inspired by adsr/phpspy.

The main difference between the two is that reli is written in almost pure PHP while phpspy is written in C. In profiling, there are cases you want to customize how and what information to get. If customizability for PHP developers matters, you can use this software at the cost of performance. (Although, we hope the cost is not too big.)

Additionally, reli can find VM state from ZTS interpreters. For example, in the daemon mode, traces of threads started via ext-parallel are automatically retrieved. Currently this cannot be done with phpspy only. Reli also provides functionality to only get the address of EG from targets, so you can use actual profiling with phpspy if you want, even when the target is ZTS.

Other features of reli that phpspy does not currently have include:

There is no particular reason why these features cannot be implemented on the phpspy side, so it may be possible to do them on phpspy in the future.

On the other hand, there are a few things that phpspy can do but reli cannot yet.

Much of what can be done with phpspy will be done with reli in the future.

Requirements

Supported PHP versions

Execution

Target

On targeting ZTS, the target process must load libpthread.so, and also you must have unstripped binary of the interpreter and the libpthread.so, to find EG from the TLS.

Installation

From Composer

From Git

From Docker

Usage

Get call traces

Daemon mode

top-like mode

Get the address of EG

[Experimental] Dump the memory usage of the target process

Examples

Trace a script

Attach to a running process

The executing process must have the CAP_SYS_PTRACE capability. (Usually run as root is enough.)

Daemon mode

The executing process must have the CAP_SYS_PTRACE capability. (Usually run as root is enough.)

Get the address of EG

The executing process must have the CAP_SYS_PTRACE capability. (Usually run as root is enough.)

Show currently executing opcodes at traces

If a user wants to profile a really CPU-bound application, then he or she wouldn't only want to know what line is slow, but what opcode is. In such cases, use --template=phpspy_with_opcode with inspector:trace or inspector:daemon.

The output would be like the following.

The currently executing opcode becomes the first frame of the callstack. So visualizations of the trace like flamegraph can show the usage of opcodes.

For informational purposes, executing opcodes are also added to each end of the call frames. Except for the first frame, opcodes for function calls such as ZEND_DO_FCALL should appear there.

If JIT is enabled at the target process, this information may be slightly inaccurate.

Use in a docker container and target a process on host

Generate flamegraphs from traces

The generated flamegraph below visualizes traces from the execution of the psalm command.

flame

Generate the speedscope format from phpspy compatible traces

See #101.

Generate the callgrind format output from phpspy compatible traces and visualize it with kcachegrind

Dump the memory usage of the target process

[!CAUTION] Don't upload the output of this command to the internet, because it can contain sensitive information of the target script!!!

[!WARNING]
This feature is in an experimental stage and may be less stable than others. The contents of the output may change in the near future.

Only NTS targets are supported for now.

The output would be like the following.

And you can get the call trace from the dump.

You can also see the contents of the local variables of a specific call frame.

If a context is referencing another location in the dump file, it can also be extracted with jq.

You can also extract all references to a specific object.

The refcount of the object recorded in the memory location is 6 in this example. Calling methods via $obj->call() adds refcount by 1, but $this->call() doesn't add refcount. References from objects_store don't add refcount too. So all 6 references are analyzed here.

See ./docs/memory-profiler.md for more info.

Troubleshooting

I get an error message "php module not found" and can't get a trace!

If your PHP binary uses a non-standard binary name that does not end with /php, use the --php-regex option to specify the name of the executable (or shared object) that contains the PHP interpreter.

I don't think the trace is accurate.

The -S option will give you better results. Using this option stops the execution of the target process for a moment at every sampling, but the trace obtained will be more accurate. If you don't stop the VMs from running when profiling CPU-heavy programs such as benchmarking programs, you may misjudge the bottleneck, because you will miss more VM states that transition very quickly and are not detected well.

Trace retrieval from ZTS target does not work on Ubuntu 21.10 or later.

Try to specify --libpthread-regex="libc.so" as an option.

I can't get traces on Amazon Linux 2.

First, try cat /proc/<pid>/maps to check the memory map of the target PHP process. If the first module does not indicate the location of the PHP binary and looks like an anonymous region, try to specify --php-regex="^$" as an option.

Goals

We would like to achieve the following 5 goals through this project.

LICENSE

What does the name "Reli" mean?

Given its functionality, you might naturally think that the name stands for "Reverse Elephpantineer's Lovable Infrastructure". But unfortunately, it's not true.

"Reli" means nothing, though you are free to think of this tool as something reliable, religious, relishable, or whatever other reli-s you like.

Initially, the name of this tool was just "php-profiler". Due to a licensing problem (#175), this simple good name had to be changed.

So we applied a randomly chosen string manipulation function to the original name. strrev('php-profiler') results to 'reliforp-php', and it can be read as "reli for p(php)".

Thus, the name of this tool is "Reli for PH*" now. And you can also call it just "Reli".

See also


All versions of php-profiler with dependencies

PHP Build Version
Package Version
Requires php Version ^8.0
ext-ffi Version *
ext-filter Version *
ext-json Version *
ext-pcntl Version *
symfony/console Version 6.0.3
php-di/php-di Version 6.3.5
amphp/parallel Version 1.4.1
amphp/amp Version 2.6.1
hassankhan/config Version 3.0.0
sj-i/php-cast Version 1.0.0
monolog/monolog Version 2.3.5
myclabs/php-enum Version 1.8.3
webmozart/assert Version 1.10.0
Composer command for our command line client (download client) This client runs in each environment. You don't need a specific PHP version etc. The first 20 API calls are free. Standard composer command

The package sj-i/php-profiler contains the following files

Loading the files please wait ....