Download the PHP package sidcorp-resource/api-metrics-exporter without Composer
On this page you can find all versions of the php package sidcorp-resource/api-metrics-exporter. It is possible to download/install these versions without Composer. Possible dependencies are resolved automatically.
Download sidcorp-resource/api-metrics-exporter
More information about sidcorp-resource/api-metrics-exporter
Files in sidcorp-resource/api-metrics-exporter
Package api-metrics-exporter
Short Description Laravel 9+ API metrics exporter for Prometheus and Grafana dashboards
License MIT
FAQ
Example:
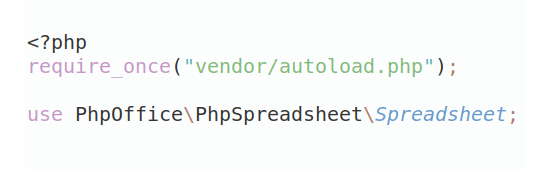
In general, it is recommended to use always a project to download your libraries. In an application normally there is more than one library needed.
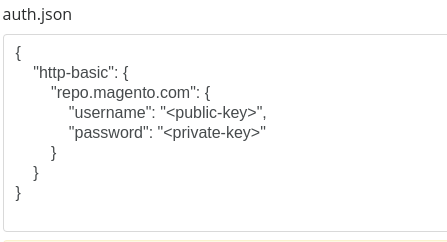
- Some hosting areas are not accessible by a terminal or SSH. Then it is not possible to use Composer.
- To use Composer is sometimes complicated. Especially for beginners.
- Composer needs much resources. Sometimes they are not available on a simple webspace.
- If you are using private repositories you don't need to share your credentials. You can set up everything on our site and then you provide a simple download link to your team member.
- Simplify your Composer build process. Use our own command line tool to download the vendor folder as binary. This makes your build process faster and you don't need to expose your credentials for private repositories.
Informations about the package api-metrics-exporter
Laravel API Metrics Exporter
A robust, production-ready metrics collection library for Laravel 9+ APIs. Effortlessly collect Prometheus-compatible metrics for your API endpoints with zero configuration and seamless integration.



Features
- Zero-configuration setup – Works out of the box with sensible defaults
- Automatic API metrics collection:
- Request counts by endpoint, method, status, and user
- Response time histograms for percentile analysis
- Daily unique user tracking
- Prometheus OpenMetrics format – Standard
/metricsendpoint with proper naming conventions - Multiple storage backends:
- Redis (recommended for production, requires phpredis extension)
- InMemory (for testing/development)
- Production-ready – Graceful error handling and lightweight middleware
- Strict Prometheus compliance – All metrics follow Prometheus naming conventions and exposition format
Requirements
- PHP 8.1 or higher
- Laravel 9.0 or higher
- PHP Redis extension (ext-redis) for production use
Quick Start
1. Install
2. Add Middleware
Add the middleware to your app/Http/Kernel.php:
3. View Metrics
Visit http://your-app.com/metrics to see your metrics in Prometheus format.
The library will automatically start collecting metrics using Redis (with InMemory fallback if Redis is unavailable).
Configuration (Optional)
You can customize the default configuration by publishing the config file:
Key configuration options in config/api-metrics.php:
Securing the /metrics Endpoint
HTTP Basic Authentication
You can enable HTTP Basic Auth for the /metrics endpoint to restrict access:
-
Set the following in your
.envfile: - The exporter will require these credentials for all requests to
/metrics.
TLS/HTTPS
Note: TLS/HTTPS is handled by your web server (Nginx, Apache, etc.) or Laravel Valet/Homestead. The library does not manage TLS certificates directly.
IP Whitelisting / Network Security
For additional security, you should restrict access to
/metricsat the firewall, load balancer, or web server level (e.g. allow-list Prometheus server IPs only).
Prometheus Scrape Config Examples
Basic Auth Example
Usage
Default Metrics
The middleware automatically collects:
api_requests_total– Total requests by endpoint/method/status/userapi_request_duration_seconds– Response time histogramunique_users_total– Daily unique users per endpoint
Custom Metrics
Currently, the library does not support registering custom drivers, exporters, or decorators via API. These features may be considered for future releases.
Dependency Injection
You can inject the collector into your controller:
Monitoring & Grafana
Prometheus Configuration
Example Grafana Queries
Request Rate:
95th Percentile Response Time:
Error Rate:
Unique Users (per endpoint per day):
Management
Flush Metrics
Or programmatically:
Troubleshooting
If you encounter errors related to Redis (e.g., Class "Redis" not found), ensure the PHP Redis extension is installed:
Then restart your web server and verify the extension is loaded with:
Environment Check
Create a simple compatibility check:
FAQ
Does this affect performance?
Minimal impact. The middleware is lightweight and fails gracefully.
What about high-traffic APIs?
Redis driver handles high traffic and supports horizontal scaling.
How to exclude routes?
Set excluded_paths: ['health', 'debug*'] in config (supports wildcards).
Is phpredis extension required?
Yes, as of version 2.0, the phpredis extension is required for the Redis driver.
Metric Naming Conventions
This library strictly follows Prometheus metric naming conventions to ensure compatibility with monitoring tools. See details in Metrics Conventions Documentation.
Testing
Documentation
Detailed documentation can be found in the .docs directory:
- Metrics Conventions - Naming conventions and standards
- Grafana Integration - Setting up Grafana dashboards
- Project Instructions - Development guidelines
Contributing
Contributions are welcome! Please see CONTRIBUTING.md for guidelines.
License
The MIT License (MIT). See License File for more information.
Versioning
From version v1.0.0, this project strictly follows Semantic Versioning (semver): v1.0.0, v1.0.1, v1.1.0, v2.0.0, ...
This library is developed and maintained by SidCorp IT Department.
All versions of api-metrics-exporter with dependencies

illuminate/support Version ^9.0|^10.0|^11.0|^12.0
illuminate/http Version ^9.0|^10.0|^11.0|^12.0
psr/log Version ^1.0|^2.0|^3.0
psr/http-server-middleware Version ^1.0