Download the PHP package polarity-labs/observer-agent without Composer
On this page you can find all versions of the php package polarity-labs/observer-agent. It is possible to download/install these versions without Composer. Possible dependencies are resolved automatically.
Download polarity-labs/observer-agent
More information about polarity-labs/observer-agent
Files in polarity-labs/observer-agent
Package observer-agent
Short Description Lightweight server and Laravel application monitoring agent
License MIT
FAQ
Example:
In general, it is recommended to use always a project to download your libraries. In an application normally there is more than one library needed.
- Some hosting areas are not accessible by a terminal or SSH. Then it is not possible to use Composer.
- To use Composer is sometimes complicated. Especially for beginners.
- Composer needs much resources. Sometimes they are not available on a simple webspace.
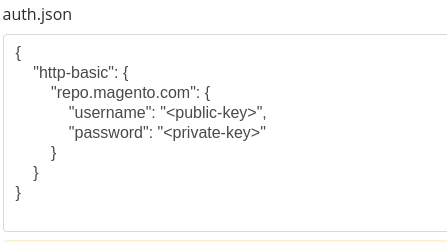
- If you are using private repositories you don't need to share your credentials. You can set up everything on our site and then you provide a simple download link to your team member.
- Simplify your Composer build process. Use our own command line tool to download the vendor folder as binary. This makes your build process faster and you don't need to expose your credentials for private repositories.
Informations about the package observer-agent
Observer
Lightweight server and Laravel application monitoring.
Observer is a monitoring agent that collects system metrics (CPU, memory, disk, network) and Laravel-specific metrics (queue health, Horizon, log errors, HTTP health checks) and sends them to a central dashboard.
Features
- Minimal overhead — The Go-based agent uses ~10MB RAM and near-zero CPU
- Zero configuration — Reads your existing
.envand Laravel config automatically - Laravel native — Install via Composer, run via Artisan
- System metrics — CPU usage, memory, disk space, network I/O, load averages
- Process monitoring — Top 10 processes by CPU and memory with 5-minute aggregated snapshots
- Spike detection — Captures CPU/memory spikes with culprit process identification for diagnosing OOM/resource issues
- Laravel metrics — Queue health, Horizon status, log error monitoring, HTTP health checks
- Custom health checks — Register arbitrary PHP callbacks (DB pings, Redis checks, etc.) alongside URL checks
- External health checks — Have Observer SaaS ping your endpoints from outside your network
- Per-check leader gating — Control whether each health check runs on the leader agent only or on all agents
- Multi-agent aware — Automatic leader election prevents duplicate system metrics when multiple apps share a server
- Reliable delivery — Buffers metrics locally if the API is unreachable
Requirements
- PHP 8.2+
- Laravel 11 or 12
- Linux or macOS server
Installation
Publish the configuration file (optional):
Configuration
Add your API key to your .env file:
That's it! The agent reads everything else from your existing Laravel configuration. The Go binary is downloaded automatically on first run.
Optional Configuration
Usage
Check configuration
This shows your current configuration and validates everything is set up correctly.
Start monitoring
The agent will run continuously, collecting and sending metrics. Press Ctrl+C to stop.
Restart after deployment
This signals the running agent to exit cleanly. When running under Supervisor with autorestart=true, the agent restarts automatically and picks up the new binary.
Add this to your deploy script after composer install.
Test mode (single collection)
Collects metrics once and exits. Useful for testing your configuration.
Health Checks
Observer supports three types of health checks:
URL Health Checks (Agent)
Configured in config/observer.php. The Go agent pings these URLs from the server:
URL Health Checks (External)
Same config format, but checked by Observer SaaS from outside your network:
The agent sends the endpoint configuration to Observer SaaS, which pings the URL every minute from its own infrastructure. This verifies your app is reachable from the outside world.
Custom Health Checks
Register arbitrary PHP callbacks to check anything — databases, Redis, external APIs, file systems, etc. Custom checks run inside your Laravel process (via the observer:metrics artisan command) rather than from the Go binary.
Register checks in a service provider's boot() method:
HealthCheckResult API
If a callback throws an exception, Observer catches it and reports the check as unhealthy with the exception message.
Per-Check Leader Gating
By default, all health checks (URL and custom) run only on the leader agent to avoid duplicate checks. Override this per-check:
Set leader_only: false when you want every agent instance to run the check (e.g., checking a local service on each server).
Multiple Apps on One Server
When multiple Laravel apps share a server, each runs its own Observer agent. System metrics (CPU, memory, disk, network) only need to be sent once per server, while app metrics (queues, logs, health checks) are unique to each app.
Observer handles this automatically via file-based leader election. The first agent to start acquires a lock and becomes the leader (sends system + app metrics). Other agents become followers (send app metrics only). If the leader stops, a follower is promoted within ~10 seconds.
No configuration is needed — the default OBSERVER_SYSTEM_METRICS=auto works transparently for both single-app and multi-app setups.
To override the automatic behavior:
Running in Production
For production, run the agent under a process manager like Supervisor:
Then:
Testing
License
MIT License. See LICENSE for details.
All versions of observer-agent with dependencies

illuminate/console Version ^11.0|^12.0|^13.0
illuminate/support Version ^11.0|^12.0|^13.0