Download the PHP package pfaciana/wp-debug-bar without Composer

On this page you can find all versions of the php package pfaciana/wp-debug-bar. It is possible to download/install these versions without Composer. Possible dependencies are resolved automatically.

FAQ

After the download, you have to make one include require_once('vendor/autoload.php');. After that you have to import the classes with use statements.

Example:
If you use only one package a project is not needed. But if you use more then one package, without a project it is not possible to import the classes with use statements.

In general, it is recommended to use always a project to download your libraries. In an application normally there is more than one library needed.
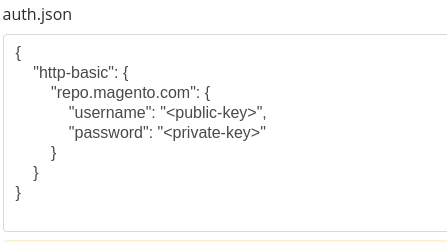
Some PHP packages are not free to download and because of that hosted in private repositories. In this case some credentials are needed to access such packages. Please use the auth.json textarea to insert credentials, if a package is coming from a private repository. You can look here for more information.

  • Some hosting areas are not accessible by a terminal or SSH. Then it is not possible to use Composer.
  • To use Composer is sometimes complicated. Especially for beginners.
  • Composer needs much resources. Sometimes they are not available on a simple webspace.
  • If you are using private repositories you don't need to share your credentials. You can set up everything on our site and then you provide a simple download link to your team member.
  • Simplify your Composer build process. Use our own command line tool to download the vendor folder as binary. This makes your build process faster and you don't need to expose your credentials for private repositories.
Please rate this library. Is it a good library?

Informations about the package wp-debug-bar

WP Debug Bar

A Debug Bar for WordPress inspired by (and compatible with) Debug Bar by wordpressdotorg with my own opinionated take on usability and features

This repo is designed to work with and support existing Debug Bar plugins.

Getting Started

Install as a composer package in the same directory as your file with your plugin header comments.

And if you're not already using other composer packages, then add the autoload.php right after your plugin header comments.

You can install WP Debug Bar in all your plugins, but only the first instance run will get loaded. The rest will be ignored.

A couple differences between the original Debug Bar by wordpressdotorg and this, is the option to quickly disable a Panel without having to disable the entire plugin. You just click on the toggle icon next to the Panel name, and that code won't run on next page load. This is extremely helpful since some Panels are resource intensive, and you may not want to be constantly enabling and disabling plugins while debugging a stubborn issue.

This project also allows for the ability to easily change which User Roles can see a Panel. Sometimes (on staging) you may want to debug something only a Guest sees. You can temporarily change that on the Settings Panel. By default, Panels can decide the minimum capability required for a Panel to be visible. This is usually because a Panel might display sensitive data that should not be accessed by a guest or user with lesser capabilities. If not explicitly set by the Panel, a Panel defaults to edit_posts. However, if you're absolutely sure you want to expose that data in a controlled environment, you can override this with the debug_bar_panel_capability filter, shown here...

A full list of panels that come with WP Debug can be seen at the bottom of this documentation.

The next few sections will detail user defined code that can interact with specific Debug Panels

Kint Debugger & Console Class

WP Debug Bar comes with a custom Kint Debugger Panel for output from Kint Debugger

NOTE: Both the Kint Panel and the Kint Debugger are bundled with this install

While the following default usage of Kint still works...

...it is recommended to use the new console instance created by WP Debug Bar (instead of the Kint instance) for methods, because there are a few enhancements that improve the experience.

WP Debug Bar console

console is a replacement for the Kint methods dump and trace, along with additional methods designed to act and function similar to the console in the browser. So Kint::dump() becomes console::log() and Kint::trace() becomes console::trace(). And if you're familiar with console.log() or console.assert(), etc, those will function in a similar way. In addition to displaying content to the Kint Panel, these methods also return relevant data to be used in your code. Here are the rest of the methods available...

The following methods all accept additional variables, as $context arguments, to be appended to the bottom of the group for extra context. The $context arguments are optional.

Log Levels

Similar to the PSR-3: Logger Interface

Testing conditions

Timers

You can manage multiple timers by defining the $label. Otherwise, all timer methods apply to the same group by default.

Counters

You can manage multiple counters by defining the $label. Otherwise, all timer methods apply to the same group by default.

Memory checking

WordPress Hooks

While it is not recommended to use debugging tools like this on production, you may want to use it on a dev, staging or testing environment. To that point, there may be concerns of accidentally pushing code with console to different environments where WP Debug Bar is not installed. If that were the case, then the missing console would throw an error. So, if you are concerned about this, you can use WordPress Hooks to output to the Kint Panel. In that scenario, even if that code gets pushed by mistake, the hook will simply do nothing, avoiding a PHP error. Hook names accept both :: and . concatenation for classes and methods. So BOTH console::log and console.log action names work. I find it easier and quicker to type dot notion, so I added that extra option.

WP Debug Bar also publishes actions for specific console events that may be useful for notifying third party tools.

Tracking Hooks that fire in a section of code

Sometimes you may want to know what hooks are fired along with their inputs and output. For example, there is third party code that outputs something to the buffer, and you'd like to modify that text. The third party documentation may be lacking, and trying to set breakpoint to debug may take a very long time if there is a lot of nested code. It would be ideal to find out what filters get run on that function call to see if you can modify it with a hook in your plugin or theme. That's where hook tracking comes in. It shows up on the Hooks Panel in WP Debug Bar whenever a watcher is set.

How to use

When you do that, a new Tracking section will show up in the Hooks Panel. It will only show the hooks fired between the debugbar/watch and debugbar/unwatch actions. Now you can see if a relevant filter exists and hook into to modify the output.

Alternative use

These do the same thing, but may be a preferable alternative.

Multiple trackers

Filtering trackers

Sometimes there may be dozens or hundreds of filters that show up in the tracker table. So you can also shrink this list by using the debugbar/watch/filter filter.

Routines

This also bundles another project of mine called WP Routines. You can check out that project along with its documentation for more info. WP Routines is a standalone project that does not need WP Debug Bar to work, but WP Debug Bar extends its functionality to work with Debug Bar Panels.

Built-in Panels

Environment

Globals

Templating

Blocks

Post Types

User Roles & Capabilities

Styles & Scripts

Rewrite Rules

SQL Queries

WordPress Hooks

Kint Debugger

WP Routines


Special Thanks

To Tabulator, Kint, any open source software that provided inspiration, and of course WordPress


All versions of wp-debug-bar with dependencies

PHP Build Version
Package Version
Requires kint-php/kint Version ^3
greenlion/php-sql-parser Version ^4
pfaciana/wp-routines Version ^0
ext-json Version *
Composer command for our command line client (download client) This client runs in each environment. You don't need a specific PHP version etc. The first 20 API calls are free. Standard composer command

The package pfaciana/wp-debug-bar contains the following files

Loading the files please wait ....