Download the PHP package mouf/html.widgets.statsgrid without Composer
On this page you can find all versions of the php package mouf/html.widgets.statsgrid. It is possible to download/install these versions without Composer. Possible dependencies are resolved automatically.
Download mouf/html.widgets.statsgrid
More information about mouf/html.widgets.statsgrid
Files in mouf/html.widgets.statsgrid
Package html.widgets.statsgrid
Short Description This PHP package contains a HTML pivot table. You provide it with a data set and the list of columns and rows and it will display a nice pivot table.
License MIT
Homepage https://github.com/thecodingmachine/html.widgets.statsgrid
FAQ
Example:
In general, it is recommended to use always a project to download your libraries. In an application normally there is more than one library needed.
- Some hosting areas are not accessible by a terminal or SSH. Then it is not possible to use Composer.
- To use Composer is sometimes complicated. Especially for beginners.
- Composer needs much resources. Sometimes they are not available on a simple webspace.
- If you are using private repositories you don't need to share your credentials. You can set up everything on our site and then you provide a simple download link to your team member.
- Simplify your Composer build process. Use our own command line tool to download the vendor folder as binary. This makes your build process faster and you don't need to expose your credentials for private repositories.
Informations about the package html.widgets.statsgrid
StatsGrid: a PHP pivot table
StatsGrid is a PHP library that let's you generate HTML pivot tables from any dataset. You give the data to be rendered as an array to StatsGrid and it will render the HTML. For instance, you can give this array:
and StatsGrid can generate this kind of reports:
| 2009 | 2010 | ||||||||||||
| February | April | May | April | May | June | ||||||||
| Sales | Prof. | Sales | Prof. | Sales | Prof. | Sales | Prof. | Sales | Prof. | Sales | Prof. | ||
| US | Chicago | 12 | 2 | 12 | 2 | ||||||||
| NY | 15 | 5 | |||||||||||
| Baltimore | 42 | 3 | 24 | 4 | |||||||||
| FR | Paris | 12 | 2 | 12 | 2 | ||||||||
Installing StatsGrid:
StatsGrid comes as a composer package (the name of the package is mouf/html.widgets.statsgrid)
Not used to Composer? The first step is installing Composer. This is essentially a one line process:
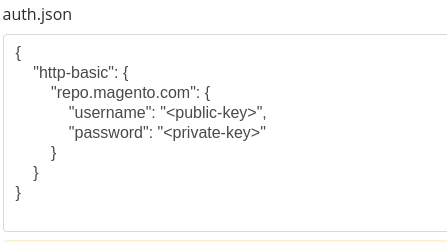
Windows users can download the phar file here: [http://getcomposer.org/download/](install composer). Then create a composer.json file at the root of your project:
and finally, run
Usage sample:
To generate a statsgrid, you need several things:
- obviously, a dataset (the raw data that you will render)
- you will also need a set of row and a set of column descriptors (describing what should be in row and what should be in column)
- finally, you need to decide what values are to be displayed in the grid
StatsGrid is compatible with Mouf so you can completely define a grid using Mouf's graphical interface.
Not using Mouf? You should! But here is a sample code base anyway:
Adding aggregation (sums/means...):
Presenting data in a pivot table is nice, but often, you will find out you want to display sums or means of the data at the bottom of the table. StatsGrid let's you aggregate data (performing sums/means...) on any column or any row. This way, you can perform sums / subsums, etc... the way you want.
In order to aggregate data, you just need to call the addAggregator method and pass a valid aggregator object.
In the sample above we decide we want to sum data by country/city and year/month. Therefore, we create 4 SumAggregator objects. For each aggregator we need:
- The column/row we will be summing upon
- The object representing the value we will be summing
- The title of the aggregator
By just adding those 4 lines, we will get this:
| 2009 | 2010 | Total year | ||||||||
| February | April | May | Total month | April | May | June | Total month | |||
| US | Chicago | 12 | 12 | 24 | 0 | 24 | ||||
| NY | 15 | 15 | 0 | 15 | ||||||
| Baltimore | 42 | 42 | 24 | 24 | 66 | |||||
| Total city | 12 | 54 | 15 | 81 | 24 | 0 | 0 | 24 | 105 | |
| FR | Paris | 0 | 12 | 12 | 24 | 24 | ||||
| Total city | 0 | 0 | 0 | 0 | 0 | 12 | 12 | 24 | 24 | |
| Total Sales | 12 | 54 | 15 | 81 | 24 | 12 | 12 | 48 | 129 | |
Displaying several values:
If you look at the dataset we have been working on, we have 2 sets of values: "sales" and "profit". So far, we have been displaying only the "sales" value. However, stats grid can perfectly handle displaying 2 values next to each other.
For instance, you could write:
This will displays The 2 values in 2 columns. If you want values to be displayed in rows rather in column, just add:
Sorting columns/rows headers
In the exemple above, the years are sorted numerically (2009, 2010...) However, we might very well want to alter this order. Maybe we want to store the result in reverse order. Or maybe we want the result not to be sorted at all (and be displayed in the order of the origin dataset).
For these use case, there is the setSort method. This function takes a boolean (true|false), or
a callable function that will be called to compare 2 items (just like the usort PHP function).
Here is an example to sort the columns in reverse order:
Styling statsgrids:
Statsgrid comes with a default CSS stylesheet. You can find it in css/dist/statsgrid.css.
Using composer? Add this to your theme:
By default the grid is in blueish tones.
You can change the main CSS class of the grid using:
Those are valid CSS classes defined in the statsgrid package:
- bluestatsgrid
- redstatsgrid
- greenstatsgrid
- greystatsgrid
- yellowstatsgrid
- purplestatsgrid
- cyanstatsgrid
You can of course provide your own class to suit your needs. The css/src/statsgrid.scss file contains the SASS file that has been used to generate those themes easily.