Download the PHP package memran/marwa-debugbar without Composer
On this page you can find all versions of the php package memran/marwa-debugbar. It is possible to download/install these versions without Composer. Possible dependencies are resolved automatically.
FAQ
Example:
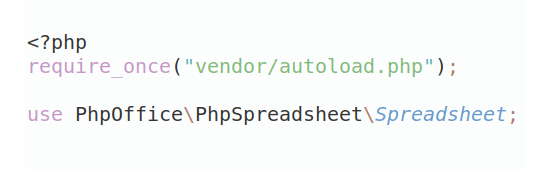
In general, it is recommended to use always a project to download your libraries. In an application normally there is more than one library needed.
- Some hosting areas are not accessible by a terminal or SSH. Then it is not possible to use Composer.
- To use Composer is sometimes complicated. Especially for beginners.
- Composer needs much resources. Sometimes they are not available on a simple webspace.
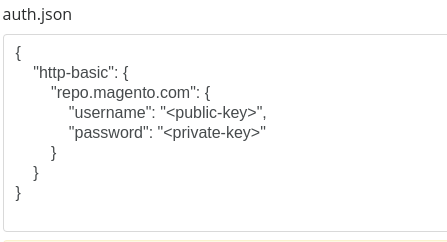
- If you are using private repositories you don't need to share your credentials. You can set up everything on our site and then you provide a simple download link to your team member.
- Simplify your Composer build process. Use our own command line tool to download the vendor folder as binary. This makes your build process faster and you don't need to expose your credentials for private repositories.
Informations about the package marwa-debugbar
Marwa DebugBar






A lightweight, framework-agnostic debug bar for PHP applications. It collects timing, logs, SQL queries, dumps, exceptions, request data, session data, and runtime KPIs without requiring a specific framework.
Why This Package
memran/marwa-debugbar is designed for plain PHP, small custom frameworks, and package-level integrations where you want:
- a self-contained in-browser debug bar
- explicit collector registration
- no framework lock-in
- low ceremony instrumentation
- extension points for your own collectors
Use it for local development and diagnostics. Do not treat it as production monitoring.
Requirements
- PHP 8.1+
ext-json
Optional integrations:
psr/logfor forwarding logs to a PSR-3 loggersymfony/var-dumperfor richer dump formattingtwig/twigfor the optional Twig dump extension
Installation
Quick Start
Tutorial
1. Create the debug bar
The constructor accepts a single flag:
true: start collecting immediatelyfalse: keep the bar dormant until you callenable()
2. Register the collectors you want
Collectors are opt-in. Register only what you need.
3. Instrument your request lifecycle
4. Render it at the end of the response
5. Use helper functions if you prefer a global entry point
The package autoloads two helpers:
Configuration
Base toggle
The package does not force a configuration system. The simplest approach is environment variables:
Recommended policy:
- enable only in local or explicitly trusted environments
- disable in staging and production unless you fully control access
Alert thresholds
If you register AlertCollector, these environment variables are supported:
| Variable | Default | Meaning |
|---|---|---|
DEBUGBAR_ALERTS_ENABLED |
1 |
Turns alert evaluation on or off |
DEBUGBAR_SLOW_QUERY_MS |
100 |
Threshold for a slow SQL query |
DEBUGBAR_SLOW_REQUEST_MS |
1000 |
Threshold for total request duration |
DEBUGBAR_SLOW_SPAN_MS |
250 |
Threshold for delta between consecutive timeline marks |
DEBUGBAR_HIGH_MEMORY_MB |
64 |
Threshold for peak memory usage |
DEBUGBAR_LARGE_RESPONSE_BYTES |
1048576 |
Threshold for buffered response size |
Severity rules are deterministic:
warningwhen the metric reaches the thresholdcriticalwhen the metric is at least2xthe threshold
Example:
140 msquery withDEBUGBAR_SLOW_QUERY_MS=100=>warning220 msquery withDEBUGBAR_SLOW_QUERY_MS=100=>critical
Built-In Collectors
| Collector | Key | Purpose |
|---|---|---|
KpiCollector |
kpi |
Request KPIs such as duration, SQL time, status, memory, and response size |
AlertCollector |
alerts |
Performance warnings for slow queries, spans, request duration, memory, and response size |
TimelineCollector |
timeline |
Chronological marks and deltas between marks |
VarDumperCollector |
dumps |
Dumps added through addDump() or db_dump() |
LogCollector |
logs |
Structured log entries added through log() |
ExceptionCollector |
exceptions |
Captured exceptions and stack traces |
DbQueryCollector |
queries |
SQL statements, params, durations, and connection names |
MemoryCollector |
memory |
Current and peak PHP memory usage |
PhpCollector |
php |
PHP version, extensions, and opcache status |
RequestCollector |
request |
Sanitized request metadata, headers, input, cookies, files, and server values |
SessionCollector |
session |
Sanitized session metadata and attributes |
CacheCollector |
cache |
Placeholder/example collector for cache metrics |
Example registration sets
Minimal:
Full diagnostics:
Public API Reference
DebugBar
__construct(bool $enabled = false)
Create a new bar.
enable(): void
Start collecting data.
disable(): void
Stop collecting new state.
isEnabled(): bool
Check whether collection is active.
setLogger(LoggerInterface $logger): void
Mirror log calls to your PSR-3 logger.
setMaxDumps(int $maxDumps): void
Cap retained dump entries.
getStartTime(): float
Return the request start timestamp recorded by the bar.
elapsedMilliseconds(): float
Return current elapsed time from the bar start.
collectors(): CollectorManager
Access the collector registry.
mark(string $label): void
Create a timeline mark.
log(string $level, string $message, array $context = []): void
Add a structured log record.
addQuery(string $sql, array $params = [], float $durationMs = 0.0, ?string $connection = null): void
Add a SQL query record.
addDump(mixed $value, ?string $name = null, ?string $file = null, ?int $line = null): void
Add a dump entry.
addException(Throwable $exception): void
Record an exception manually.
registerExceptionHandlers(bool $capturePhpErrorsAsExceptions = true): void
Capture uncaught exceptions and optionally PHP errors.
Disable PHP error conversion if you only want uncaught exceptions:
state(): DebugState
Expose the immutable state passed into collectors.
CollectorManager
register(string $collectorClass, bool $enabled = true): void
Register a collector class.
setEnabled(string $key, bool $enabled): void
Enable or disable a registered collector by key.
autoDiscover(string $directory, string $baseNamespace): int
Scan a directory for collector classes.
renderAll(DebugState $state): array
Render all enabled collectors and return their metadata, HTML, and collected data. This is mainly useful for advanced integrations and tests.
metadata(): array
Return enabled collector metadata without rendering.
Renderer
__construct(DebugBar $debugBar)
Create the renderer.
render(): string
Render the full HTML and JavaScript for the debug bar.
Global helper functions
debugbar(): DebugBar
Resolve a shared global debug bar instance.
db_dump(mixed $value, ?string $name = null): void
Shortcut for debugbar()->addDump(...).
Collector contract
Implement this interface to create your own tab.
Collector::key(): string
Return a unique tab key.
Collector::label(): string
Return the visible tab label.
Collector::icon(): string
Return a small icon string.
Collector::order(): int
Return the sort order.
collect(DebugState $state): array
Collect tab data from the immutable state.
renderHtml(array $data): string
Return the tab HTML.
Custom Collector Example
Register it:
Alerts Tab
AlertCollector adds a dedicated Alerts tab that summarizes slow runtime behavior in one place.
It detects:
- slow queries
- slow total request duration
- slow timeline spans between consecutive marks
- high peak memory usage
- large buffered response size
Each alert includes:
- severity
- type
- message
- metric value
- context
If alerts are disabled with DEBUGBAR_ALERTS_ENABLED=0, the tab renders a disabled message instead of findings.
Request and Session Redaction
RequestCollector and SessionCollector redact common secret-bearing keys such as:
passwordtokenauthorizationcookiecsrfsecret
Uploaded file metadata is summarized without exposing temporary paths.
Twig Integration
If you use Twig, register the bundled extension:
Then inside Twig templates:
Example Bootstrap
The repository ships with a small example app under example/.
Serve it locally with:
Project Layout
Development
Install dependencies:
Run the local quality checks:
Run the combined CI gate:
Apply automatic coding-standard fixes:
Testing and Quality
- PHPUnit covers core state management, collectors, rendering, and redaction behavior
- PHPStan runs at level 8
- PHPCS enforces PSR-12 across
src/,tests/, andexample/ - GitHub Actions runs validation on pushes and pull requests
Security Guidance
- keep the bar disabled outside local or explicitly trusted environments
- avoid rendering the bar for public traffic
- remember that even redacted collectors may still reveal development details
- treat alerts as local diagnostics, not production monitoring
Contributing
See AGENTS.md for repository-specific contribution guidelines, coding conventions, and review expectations.
All versions of marwa-debugbar with dependencies

ext-json Version *
memran/marwa-support Version ^1.0
psr/log Version ^1.1 || ^2.0 || ^3.0