Download the PHP package maantje/charts without Composer
On this page you can find all versions of the php package maantje/charts. It is possible to download/install these versions without Composer. Possible dependencies are resolved automatically.
FAQ
Example:
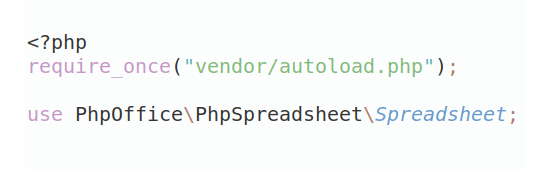
In general, it is recommended to use always a project to download your libraries. In an application normally there is more than one library needed.
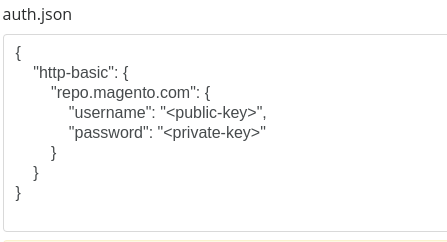
- Some hosting areas are not accessible by a terminal or SSH. Then it is not possible to use Composer.
- To use Composer is sometimes complicated. Especially for beginners.
- Composer needs much resources. Sometimes they are not available on a simple webspace.
- If you are using private repositories you don't need to share your credentials. You can set up everything on our site and then you provide a simple download link to your team member.
- Simplify your Composer build process. Use our own command line tool to download the vendor folder as binary. This makes your build process faster and you don't need to expose your credentials for private repositories.
Informations about the package charts
Charts - SVG Chart Rendering
Charts is a zero-dependency PHP library for generating SVG charts. It enables easy creation of SVG-based charts directly from PHP, with no additional dependencies required.
Features
- Simple, intuitive API for chart creation
- Lightweight, with no external dependencies
- Supports various chart types: line charts, bar charts, stacked charts, boxplots, and mixed charts
- Fully customizable and extendable
- Outputs pure SVG, allowing for:
- Embedding in PDFs, view example PDF report
Installation
To get started, install the package via composer:
Usage Examples
Below are some examples of the types of charts you can create using this library. Click on the links to view the source code for each example.
- Example Usage With mPDF
- Simple Line Chart
- Curved Line Chart
- Step Line Chart
- Area Line Chart
- Bar Chart
- Stacked Bar Chart
- Grouped Bar Chart
- Advanced Line Chart
- Advanced Bar Chart
- Mixed Chart
- Negative Values Chart
- Pie Chart
Example Usage With mPDF
📄 View PDF document
View source
Simple Line Chart
View source
Curved Line Chart
View source
Step line chart
View source
Area line chart
View source
Bar Chart
View source
Stacked Bar Chart
View source
Grouped Bar Chart
View source
Advanced Line Chart
View source
Advanced Bar Chart
View source
Mixed chart
View source
Negative Values Chart
View source
Simple boxplot chart
View source
Boxplot chart with a line
View source
Pie chart
View source
Usage
Creating a Chart
You can create different types of charts using the provided classes. Below are examples of how to create a simple bar chart and a line chart.
Simple Bar Chart
Simple Line Chart
Simple Boxplot Chart
The values of a boxplot are given in order: min, Q1, median, Q3, max. Any value after the fifth is an outlier and is drawn as a point.
The library does not compute quartiles: pass the five statistics already calculated.
A Boxplot is a bar like any other, so it can also be placed in Bars, next to Bar, StackedBar or BarGroup.
To draw boxplots on a secondary Y axis, pass the same yAxis name to Boxplots (it drives the axis range) and to each Boxplot (it drives the drawing), as with Bars and Bar.
Line over bars
A BarLine draws a line through the middle of each bar of a Bars series. It works with every kind of bar: Bar, StackedBar, BarGroup and Boxplot.
valuesholds one value per bar, in order.nullleaves a gap, so a line can cover only some of the bars.- Without
values, the line goes through the value of each bar: its height, the total of a stacked bar, the highest bar of a group or the median of a boxplot. - The line uses the Y axis of its bars; pass
yAxisto draw it on another one. BarLineaccepts the samesize,color,areaColor,curveandstepLineoptions asLine; points are drawn only whenpointColoris set.
List the BarLine after its bars so the line is drawn on top.
Annotations
You can add annotations to your charts for better visualization.
License
The MIT License (MIT). Please see License File for more information.