Download the PHP package liip/monitor-bundle without Composer
On this page you can find all versions of the php package liip/monitor-bundle. It is possible to download/install these versions without Composer. Possible dependencies are resolved automatically.
Download liip/monitor-bundle
More information about liip/monitor-bundle
Files in liip/monitor-bundle
Informations about the package monitor-bundle
Liip Monitor Bundle
This bundle provides a way to run a series of application related health checks. Health checks in the scope of this bundle go beyond simple actions like performing a ping to a server to see if it's alive. For example a Memcache server can be alive and not displaying any errors in your Nagios but you might not be able to access it from your PHP application. Each health check should then implement some application logic that you want to make sure always works. Another usage can be testing for specific requirements, like availability of PHP extensions.
Another design goal of the bundle was to be able to perform the checks using the same configuration and environment that your application is using. In that way you can make sure that if the health check runs successfully then your app should work too.
So each health check will be a class that will implement the CheckInterface::check
method which must return a CheckResult object. What happens inside that method
is up to the check developer.
Health checks are defined as Symfony services and they have to be tagged as
liip_monitor.check in order to be picked up by the health check runner. This gives
a lot of flexibility to application and bundle developers when they want to add their
own checks.
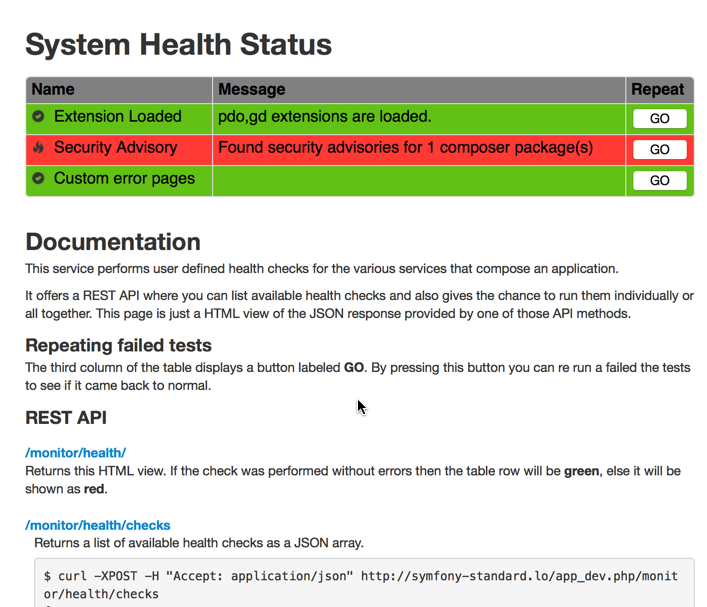
Checks are run via the command line using a Symfony command or via a REST api that delivers the results in JSON format.
Here's the web interface:

Installation
Install with composer:
Then register the bundle in the AppKernel.php file:
If you want to enable the REST API provided by the bundle then add the following to your routing.yml:
Then, enable the controller in your configuration:
And finally don't forget to install the bundle assets into your web root:
Enabling built-in health checks
To enable built-in health checks, add them to your config.yml
Adding Health Checks
See Writing Custom Checks for instructions on creating a custom check.
Once you implemented the class then it's time to register the check service with our service container:
The important bit there is to remember to tag your services with the liip_monitor.check tag.
By doing that the check runner will be able to find your checks. Keep in mind that checks
can reside either in your bundles or in your app specific code. The location doesn't matter
as long as the service is properly tagged. The alias is optional and will then simply
define the id used when running health checks individually, otherwise the full service
id must be used in this case.
If your app's service definition is using autoconfigure to discover services then classes
which implement Laminas\Diagnostics\Check\CheckInterface will be tagged automatically.
Available Built-in Health Checks
See "Full Default Config" below for a list of all built-in checks and their configuration.
Running Checks
There are two ways of running the health checks: by using the CLI or by using the REST API provided by the bundle. Let's see what commands we have available for the CLI:
List Checks
$ ./app/console monitor:list

monitor.check.jackrabbit
monitor.check.redis
monitor.check.memcache
monitor.check.php_extensions
Run All the Checks
$ ./app/console monitor:health

Jackrabbit Health Check: OK
Redis Health Check: OK
Memcache Health Check: KO - No configuration set for session.save_path
PHP Extensions Health Check: OK
Run Individual Checks
To run an individual check you need to provide the check id to the health command:
$ ./app/console monitor:health monitor.check.php_extensions

PHP Extensions Health Check: OK
Run health checks as composer post-install/update scripts
To run health checks as a composer post-install or post-update script, simply add the
Liip\\MonitorBundle\\Composer\\ScriptHandler::checkHealth ScriptHandler to the
post-install-cmd / post-update-cmd command sections of your composer.json:
Adding Additional Reporters
There are two default reporters: ArrayReporter for the REST API and ConsoleReporter for the CLI command. You can
add additional reporters to be used by either of these.
First, define an additional reporter service and tag it with liip_monitor.additional_reporter:
To run additional reporters with the CLI, add --reporter=... options for each one:
To run this reporter with the REST API, add a reporters query parameter:
/monitor/health?reporters[]=my_reporterYou can list available reporters with:
Grouping Checks
It is possible to group the health checks for different environments (e.g. application server, cron runner, ...).
If not specified differently, all health checks belong to the default group.
Define groups for build-in checks
To define groups for built-in health checks, add the following grouping hint to your config.yml:
This creates two groups, default and cron, each having different checks.
Define groups for tagged Services
To define groups for tagged services, add a group attribute to the respective tags:
autoconfigure will place checks into the default group. You must add autoconfigure: false to the service
definition to change the group:
Specify group for CLI commands
Both CLI commands have a --group=... option. If it is not given, the default group is used.
Both commands, monitor:list and monitor:health, have an option --all to list or run the checks of all registered
groups. Additionally, the monitor:list has an option --groups to list all registered groups.
Full Default Config
REST API DOCS
For documentation on the REST API see: http://myproject.org/monitor/health/.
Don't forget to add the bundle routes in your routing.xml file.
Nagios integration
You can find a simple Nagios check written in Perl and Python in the Resources/scripts directory.
Perl Version
This is dependent on perl modules available on CPAN Getopt::Std, WWW::Mechanize, and JSON
Copy the script into your scripts directory in Nagios and create a command like this:
define command{
        command_name    check_symfony_health
        command_line    $USER1$/check_symfony2.pl -H $HOSTNAME$
}
Running the command with the Hostname flag (-H) will check "http://$HOSTNAME$/monitor/health/run". You can also use the Address flag (-A) to check a specified URL:
command_line $USER1$/check_symfony2.pl -A https://mysite.org/monitor/health/runThe plugin can be used with Authentication, Using the Username (-u) and Password (-p) flags:
command_line $USER1$/check_symfony2.p1 -H $HOSTNAME$ -u username -p passwordYou can also specify the Warning (-w) and Critical (-c) levels for the check using the standard flags
command_line $USER1$/check_symfony2.pl -H $HOSTNAME$ -w 1 -c 2Any flags can be combined except -A and -H. THe -u and -p flags should always be used together.
Python Version
The Python version depends on the nagiosplugin library < 1.0.0.
Copy the script into your scripts directory in Nagios and create a command like this:
define command{
        command_name    check_symfony_health
        command_line    $USER1$/check_symfony2.py -w 0  -c 0 -u https://$HOSTNAME$
}
To use the plugin with HTTP basic authentication, change the command to:
command_line $USER1$/check_symfony2.py -w 0 -c 0 -u https://$HOSTNAME$ -a username:passwordConnecting Check to Host in Nagios
Add a service:
define service{
 hostgroup_name         Symfony2
 service_description    Symfony2 health check
 check_command          check_symfony_health
 use                    generic-service
}
And create a host attached to the Symfony2 hostgroup:
define host{
    use              web-host
    host_name        www.myhost.com
    address          8.8.8.4
    hostgroups       Symfony2
}
And place your host within the Symfony2 hostgroup.
All versions of monitor-bundle with dependencies
symfony/framework-bundle Version ^6.4|^7.0
laminas/laminas-diagnostics Version ^1.9


