Download the PHP package jmonitor/jmonitor-bundle without Composer
On this page you can find all versions of the php package jmonitor/jmonitor-bundle. It is possible to download/install these versions without Composer. Possible dependencies are resolved automatically.
Download jmonitor/jmonitor-bundle
More information about jmonitor/jmonitor-bundle
Files in jmonitor/jmonitor-bundle
Package jmonitor-bundle
Short Description Symfony bundle to collect server metrics (PHP, MySQL, PostgreSQL, Redis, Apache, Nginx, Caddy) and send them to jmonitor.io.
License MIT
Homepage https://jmonitor.io
FAQ
Example:
In general, it is recommended to use always a project to download your libraries. In an application normally there is more than one library needed.
- Some hosting areas are not accessible by a terminal or SSH. Then it is not possible to use Composer.
- To use Composer is sometimes complicated. Especially for beginners.
- Composer needs much resources. Sometimes they are not available on a simple webspace.
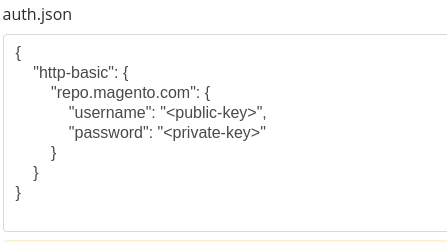
- If you are using private repositories you don't need to share your credentials. You can set up everything on our site and then you provide a simple download link to your team member.
- Simplify your Composer build process. Use our own command line tool to download the vendor folder as binary. This makes your build process faster and you don't need to expose your credentials for private repositories.
Informations about the package jmonitor-bundle
Jmonitor Bundle
Simple monitoring for PHP & Symfony stacks
Jmonitor is a monitoring service for PHP web stacks. It collects server and application metrics and turns them into readable, premade dashboards and alerts.
This bundle integrates the jmonitor/collector PHP library into Symfony.
It ships a Symfony-specific collector and a console command that runs the collectors in a long-lived PHP worker process.


Supported components
| Category | Components |
|---|---|
| Runtime | |
| Framework | |
| Web servers | |
| Databases & cache | |
| System |
Requirements


Quick Start
1) Install the bundle:
2) Create a project on https://jmonitor.io and copy your Project API key. 3) Configure your API key and collectors.
4) Run a collection manually to verify. It may be easier to do this in the production environment, since configuring the bundle (or certain collectors) in development is not always possible.
PHP metrics: CLI vs Web context
- PHP settings and extensions can differ significantly between CLI and your web server context.
- If you want metrics that reflect your web runtime, you must expose a tiny HTTP endpoint that returns PHP metrics from within that web context.
To do that, create a route config file:
Set up a firewall for this route before the main firewall to prevent your app from interfering with it:
Wire it in your bundle config
Running the collector
This command runs as a long-lived worker: it periodically collects metrics from the enabled collectors and sends them to Jmonitor.io.
You can also limit how long it runs:
--memory-limit: stop when the process memory usage exceeds the given limit (e.g.128M)--time-limit: stop after the given number of seconds
You can pass a collector name as an argument to run only that collector — useful for debugging a specific integration:
In production, it is recommended to run this command under a process manager (e.g. Supervisor or systemd) to ensure it is kept running and restarted if necessary. For practical guidance, you can follow Symfony Messenger's recommendations: https://symfony.com/doc/current/messenger.html#deploying-to-production
Logging and Debugging
- The command is resilient: individual collector failures do not crash the whole run; errors are logged (logging must be enabled in config).
- Symfony component collectors (flex, scheduler, messenger) that fail at worker startup are disabled for the lifetime of that worker process and an error is logged. Restart the worker to re-enable them.
- Log levels:
- Errors (collector exceptions, HTTP responses with status >= 400): error
- Collected metrics: debug
- Summary: info
Useful commands:
Troubleshooting
Apache
mod_status is enabled, but my endpoint is not reachable.
Don't forget to let the request pass through your index.php.
For example, if you use .htaccess :
Need help?
- Open an issue on this repo https://github.com/jmonitor/jmonitor-bundle/issues
- Open a discussion on https://github.com/orgs/jmonitor/discussions
All versions of jmonitor-bundle with dependencies

jmonitor/collector Version ^2.0
nyholm/psr7 Version ^1.8
symfony/console Version ^6.4|^7.0|^8.0
symfony/framework-bundle Version ^6.4|^7.0|^8.0
symfony/http-client Version ^6.4|^7.0|^8.0
symfony/process Version ^6.4|^7.0|^8.0
symfony/polyfill-php82 Version ^1.33