Download the PHP package github2018/charts without Composer
On this page you can find all versions of the php package github2018/charts. It is possible to download/install these versions without Composer. Possible dependencies are resolved automatically.
Download github2018/charts
More information about github2018/charts
Files in github2018/charts
Package charts
Short Description Create charts for laravel using different charts libraries
License MIT
FAQ
Example:
In general, it is recommended to use always a project to download your libraries. In an application normally there is more than one library needed.
- Some hosting areas are not accessible by a terminal or SSH. Then it is not possible to use Composer.
- To use Composer is sometimes complicated. Especially for beginners.
- Composer needs much resources. Sometimes they are not available on a simple webspace.
- If you are using private repositories you don't need to share your credentials. You can set up everything on our site and then you provide a simple download link to your team member.
- Simplify your Composer build process. Use our own command line tool to download the vendor folder as binary. This makes your build process faster and you don't need to expose your credentials for private repositories.
Informations about the package charts
DELETE vendor/github2018
charts2018
Charts is a multi-library chart package to create interactive charts using laravel.
![]()


Table Of Contents
- Installation
- Video Tutorial
- Default Settings
- Example Usage
- Create Charts
- Multi Datasets Chart
- Database Charts
- Realtime Charts
- Math Functions Charts
- Charts Functions
- Available Chart Settings
- Chart Examples
- Extend your way
Installation
Video Tutorial
To install charts use composer
Download
Add service provider & alias
Add the following service provider to the array in:
Add the following alias to the array in:
Publish the assets
Default Settings
The file in: contains an array of settings, you can find the default settings in there.
Example Usage
Example Controller:
Example View:
Create Charts
| Create Charts | line | area | bar | pie | donut | geo | gauge | temp | percentage | progressbar |
|---|---|---|---|---|---|---|---|---|---|---|
| chartjs | x | x | x | x | x | - | - | - | - | - |
| highcharts | x | x | x | x | x | x | - | - | - | - |
| x | x | x | x | x | x | x | - | - | - | |
| material | x | - | x | - | - | - | - | - | - | - |
| chartist | x | x | x | x | x | - | - | - | - | - |
| fusioncharts | x | x | x | x | x | - | - | - | - | - |
| morris | x | x | x | - | x | - | - | - | - | - |
| plottablejs | x | x | x | x | x | - | - | - | - | - |
| minimalist | x | x | x | x | x | - | - | - | - | - |
| canvas-gauges | - | - | - | - | - | - | x | x | - | - |
| justgage | - | - | - | - | - | - | x | - | x | - |
| progressbarjs | - | - | - | - | - | - | - | - | x | x |
The first argument of the create method is the chart type, and the second is the library
Multi Datasets Chart
| Multi Dataset Charts | line | area | bar | pie | donut | geo | gauge | temp | percentage | progressbar |
|---|---|---|---|---|---|---|---|---|---|---|
| chartjs | x | x | x | - | - | - | - | - | - | - |
| highcharts | x | x | x | - | - | - | - | - | - | - |
| x | x | x | - | - | - | - | - | - | - | |
| material | x | - | x | - | - | - | - | - | - | - |
| chartist | x | x | x | - | - | - | - | - | - | - |
| fusioncharts | x | x | x | - | - | - | - | - | - | - |
| morris | x | x | x | - | - | - | - | - | - | - |
| plottablejs | x | x | x | - | - | - | - | - | - | - |
| minimalist | x | x | x | - | - | - | - | - | - | - |
| canvas-gauges | - | - | - | - | - | - | - | - | - | - |
| justgage | - | - | - | - | - | - | - | - | - | - |
| progressbarjs | - | - | - | - | - | - | - | - | - | - |
To create multi-dataset charts simply add the values using the function!
- setDataset(required string $element_label, required array $values)
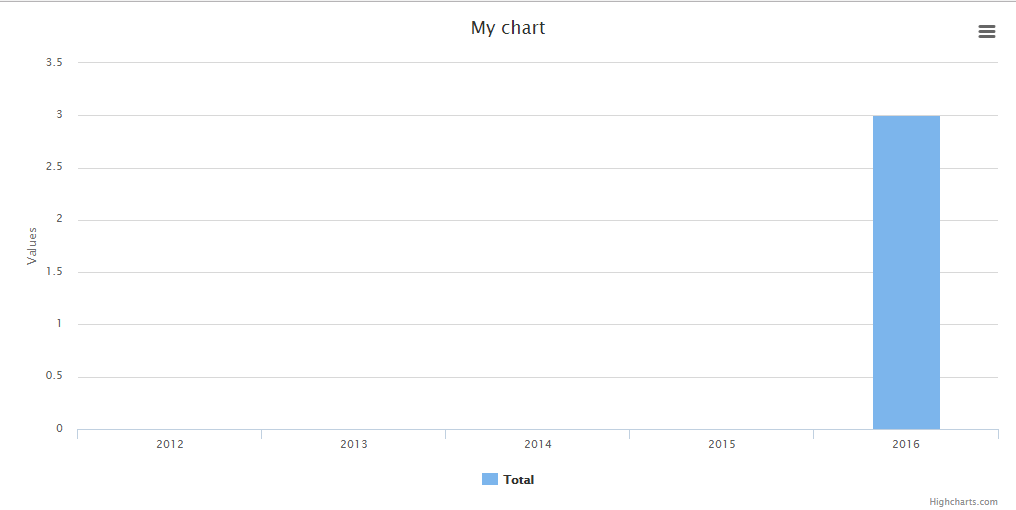
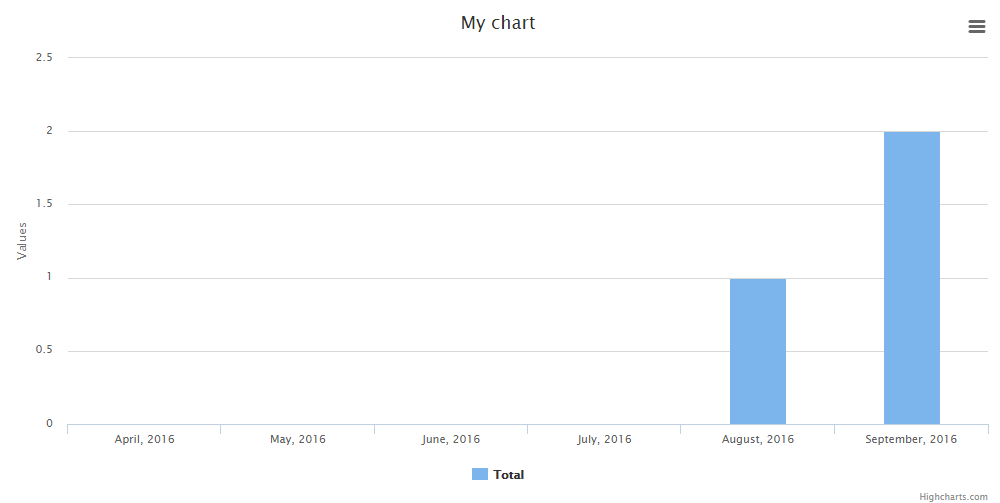
Database Charts
You can also generate database charts with simple setup!
Example data:

Note: You are required to use a specific group method before rendering the chart!
Important: To work with the GroupByYear, GroupByMonth, GroupByDay, lastByYear, lastByMonth & lastByDay you'll need the column in the data rows.
The available methods are:
-
setData(required mixed $data)
Setup the data again.
-
setDateColumn(required string $column)
Set the column to group the data.
Default:
-
setDateFormat(required string $format)
Set the fancy date format for
groupByDay()andlastByDay()function if$fancyset to true, must be called before those function.Default:
-
setMonthFormat(required string $format)
Set the fancy date format for
groupByMonth()andlastByMonth()function if$fancyset to true, must be called before those function.Default:
-
groupBy(required string $column)
Groups the data based on a column.
 ////////////////////
$users = User::where(DB::raw("(DATE_FORMAT(created_at,'%Y'))"),date('Y'))
////////////////////
$users = User::where(DB::raw("(DATE_FORMAT(created_at,'%Y'))"),date('Y')) ->get(); $chart = Charts::database($users, 'bar', 'highcharts') ->title("Monthly new Register Users") ->elementLabel("Total Users") ->dimensions(1000, 500) ->responsive(true) ->groupByMonth(date('Y'), true); ////////////////////////////////// -
groupByYear(optional int $years)
Groups the data based in years.
Default:
-
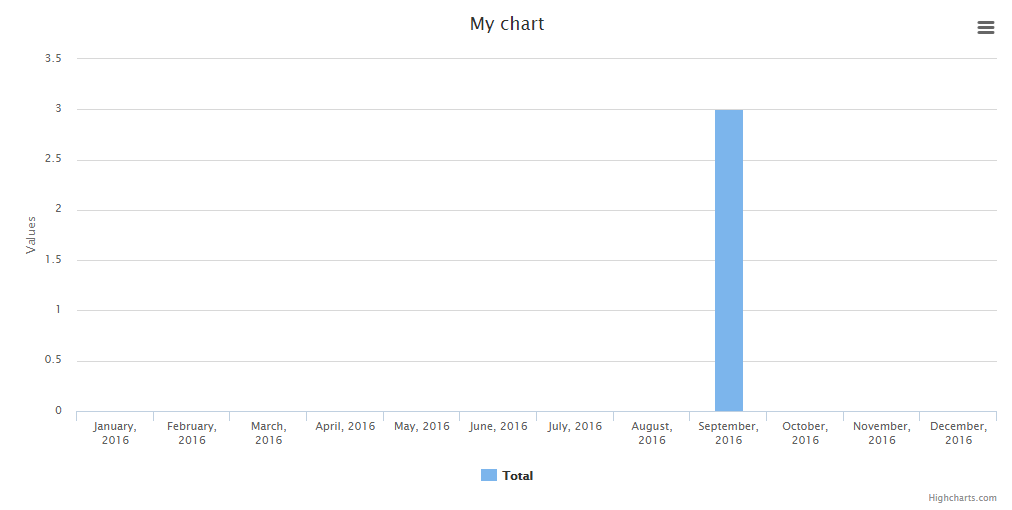
groupByMonth(optional string $year, optional boolean $fancy)
Groups the data in months (if no year set, the current one will be used).
Default:
-
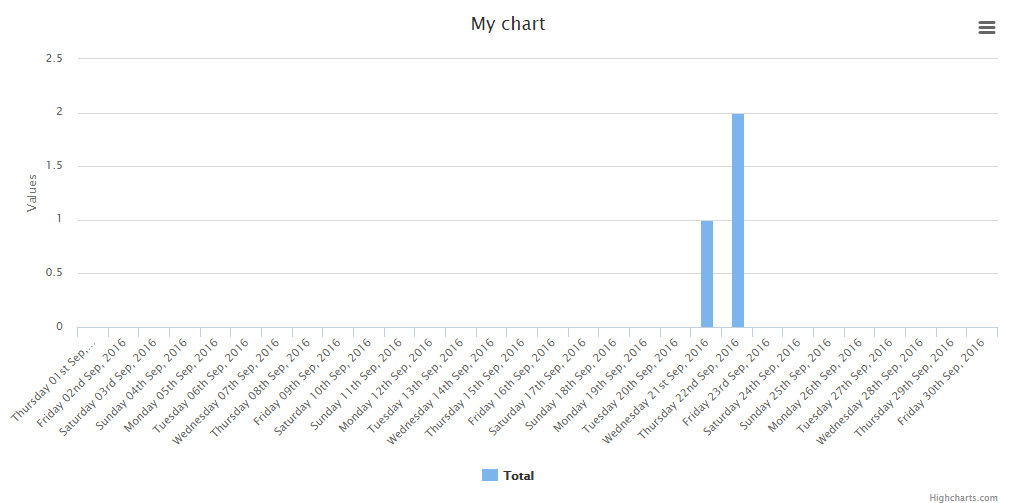
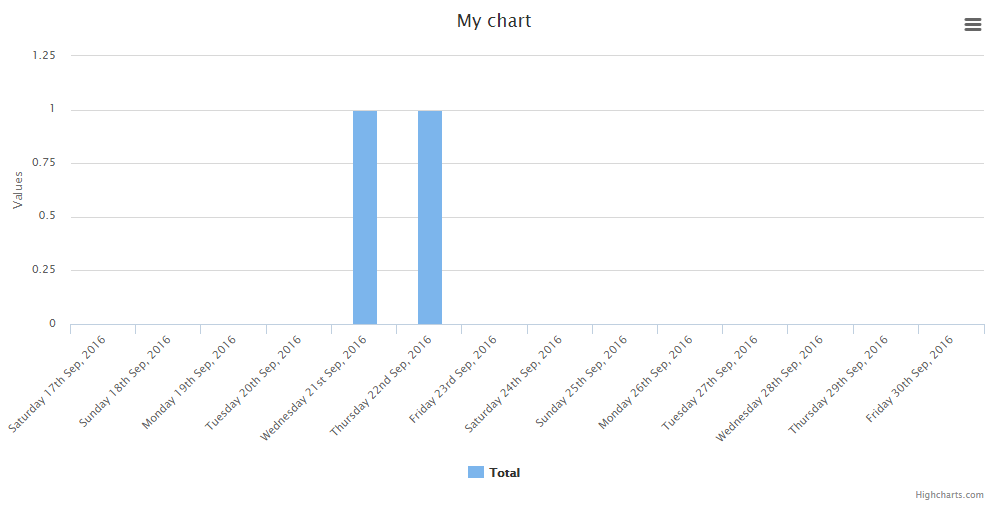
groupByDay(optional string $month, optional string $year, optional boolean $fancy)
Groups the data in days (if no year/month set, the current one will be used).
Default:
-
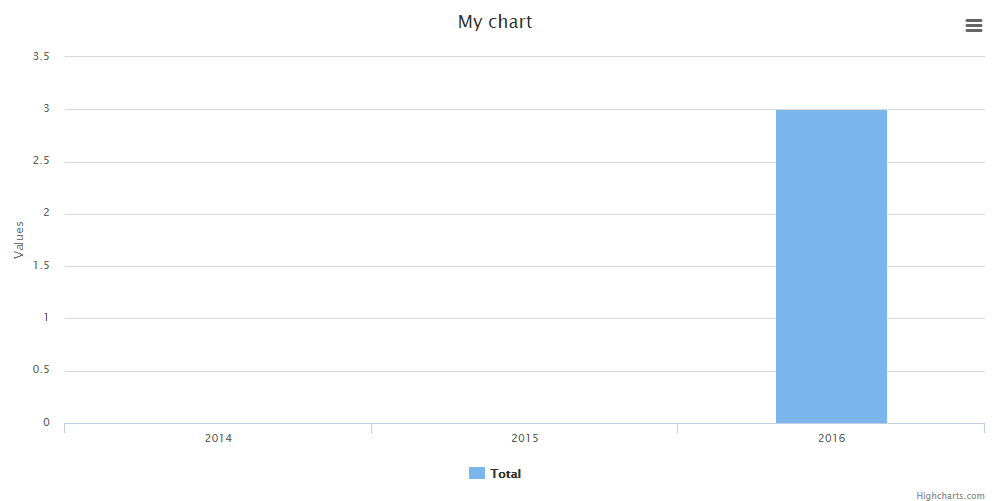
lastByYear(optional int $number)
Alias for groupByYear() method. Does the same.
Default:
-
lastByMonth(optional int $number, optional boolean $fancy)
Display the numbers of months behind (relative to the current date).
Default:
-
lastByDay(optional int $number, optional boolean $fancy)
Display the numbers of days behind (relative to the current date).
Default:
Realtime Charts
| Realtime Charts | line | area | bar | pie | donut | geo | gauge | temp | percentage | progressbar |
|---|---|---|---|---|---|---|---|---|---|---|
| chartjs | - | - | - | - | - | - | - | - | - | - |
| highcharts | x | x | x | - | - | - | - | - | - | - |
| - | - | - | - | - | - | x | - | - | - | |
| material | - | - | - | - | - | - | - | - | - | - |
| chartist | - | - | - | - | - | - | - | - | - | - |
| fusioncharts | - | - | - | - | - | - | - | - | - | - |
| morris | - | - | - | - | - | - | - | - | - | - |
| plottablejs | - | - | - | - | - | - | - | - | - | - |
| minimalist | - | - | - | - | - | - | - | - | - | - |
| canvas-gauges | - | - | - | - | - | - | x | x | - | - |
| justgage | - | - | - | - | - | - | x | - | x | - |
| progressbarjs | - | - | - | - | - | - | - | - | x | x |
You can create realtime charts.
Example json:
'value' can be changed to diferent index name with
Note: The interval is set in ms
The available methods are:
-
setValueName(required string $string)
Sets the value json index.
Default:
-
setUrl(required string $url)
Sets the url after chart object creation.
-
setInterval(required int $interval)
Sets the interval after chart object creation (ms).
-
setMaxValues(required int $number)
Sets the max ammount of values to be seen before removing the first one.
Math Functions Charts
You can create math function charts.
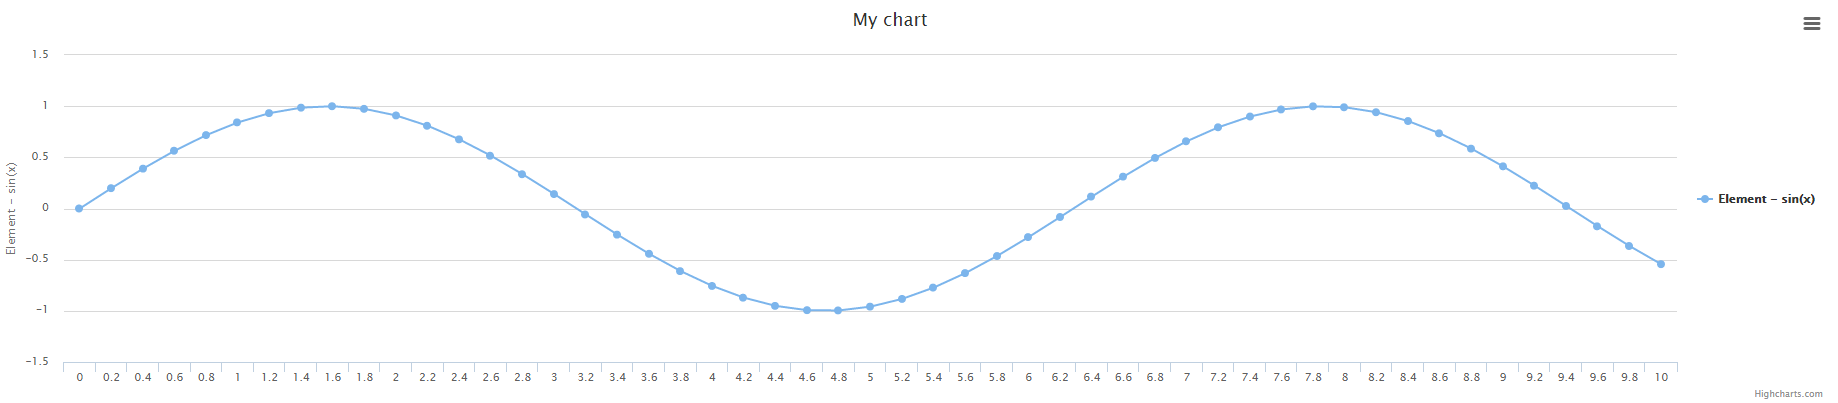
The function is , the interval is and the amplitude is
-
setFunction(required string $function)
Sets the function.
-
setInterval(required array $interval)
Sets the function / chart interval.
-
setAmplitude(required int $amplitude)
Sets the function amplitude between x points.
-
calculate()
Calculates the valeus / labels for the chart.
Note: This function is called every time a modification is made in the chart function, interval or amplitude so you don't need to call it every time you change the values. It's just an auxiliary function.
Charts Functions
-
create(optional string $type, optional string $library)
Returns a new chart instance, if no library is specified, the default one will be used.
-
database(required mixed $object, optional string $type, optional string $library)
Returns a new database chart instance that extends the base one.
-
realtime(required string $url, required int $interval, optional string $type, optional string $library)
Returns a new database chart instance that extends the base one.
-
realtime(required string $function, required array $interval, required int $amplitude, optional string $type, optional string $library)
Returns a new math function chart instance that extends the base one.
-
assets(optional array $libraries)
Returns all the assets to generate the graphs.
To output only certain libraries, add an array to it with the libraries you want
-
libraries(optional string $type)
Returns an array of all the libraries available (can be filtered).
-
types(optional string $library)
Returns an array of all the chart types available (can be filtered).
Available Chart Settings:
-
setGaugeStyle(required string $style)
Set the gauge style
Default:
Available options:
-
setType(required string $type)
Set the chart type after creation (Example: from line to pie).
-
setLibrary(required string $library)
Set the chart library after creation (Example: from highcharts to google).
-
setLabels(required array $labels)
The labels of the chart.
-
setValues(required array $values)
The values of the chart respectively.
-
setElementLabel(required string $element_label)
The element label for line / bar / geo charts.
-
setTitle(required string $title)
The chart title.
-
setColors(required array $colors)
The colors of the charts respectively.
-
setWidth(required int $width)
The chart width if non-responsive. 0 = responsive width.
-
setHeight(required int $height)
The chart height if non-responsive. 0 = responsive height.
-
setDimensions(required int $width, required int $height)
The chart dimensions (shortcut to set width, height with one funcion).
-
setResponsive(required boolean $responsive)
Set if the chart is responsive or not. If not, the chart dimensions will be used.
-
settings()
Return the chart settings.
-
render()
Render the chat.
Chart Examples
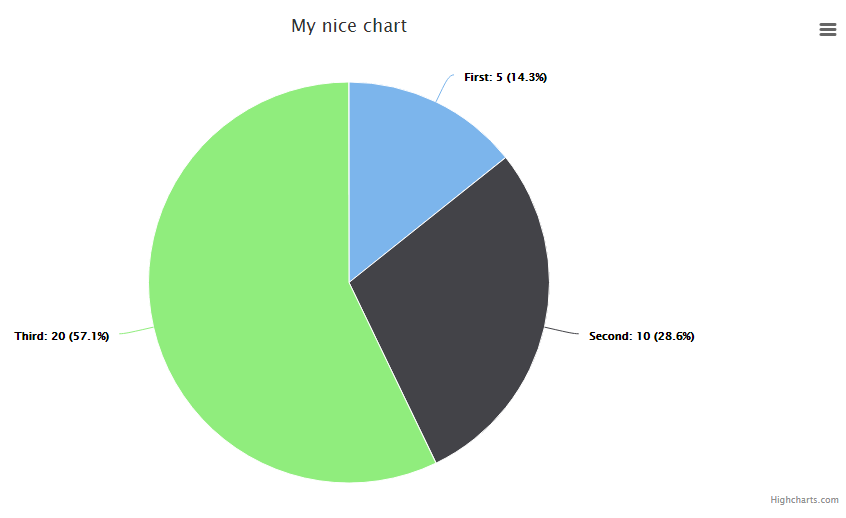
Pie
Note: can't change the color of this chart. Well it can but it's complicated, so I leave it here.
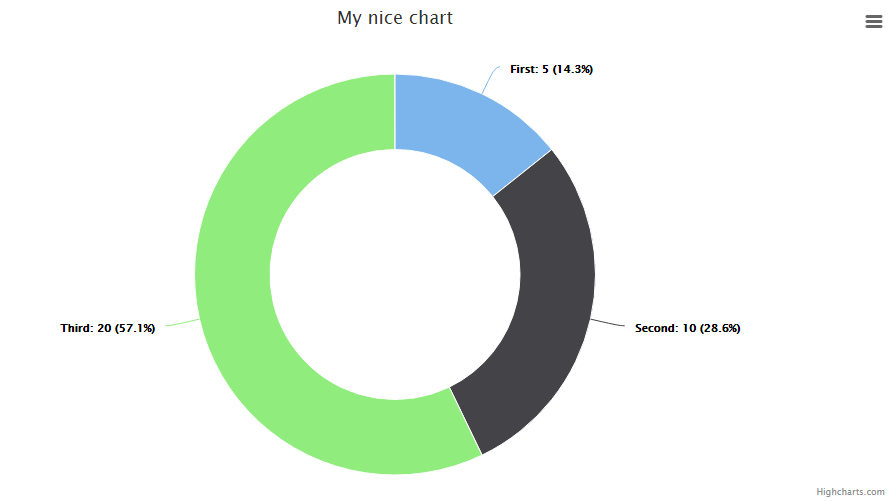
Donut / Doughnut
Note: and can't change the color of this chart. Well they can but it's complicated, so I leave it here.
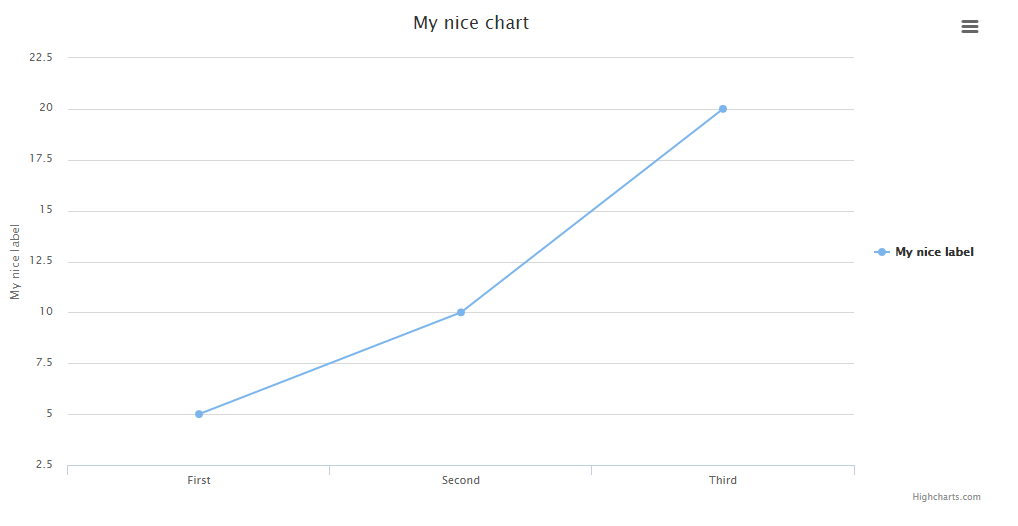
Line
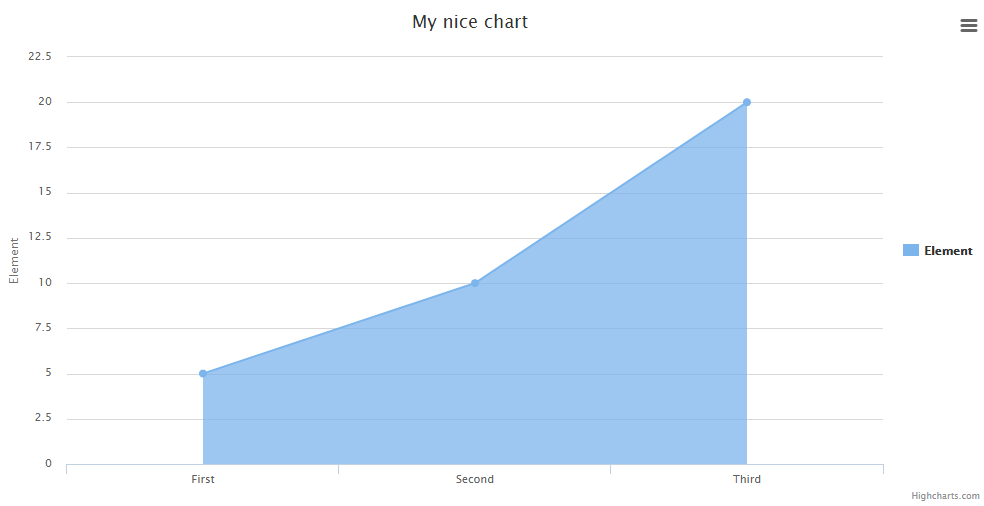
Area
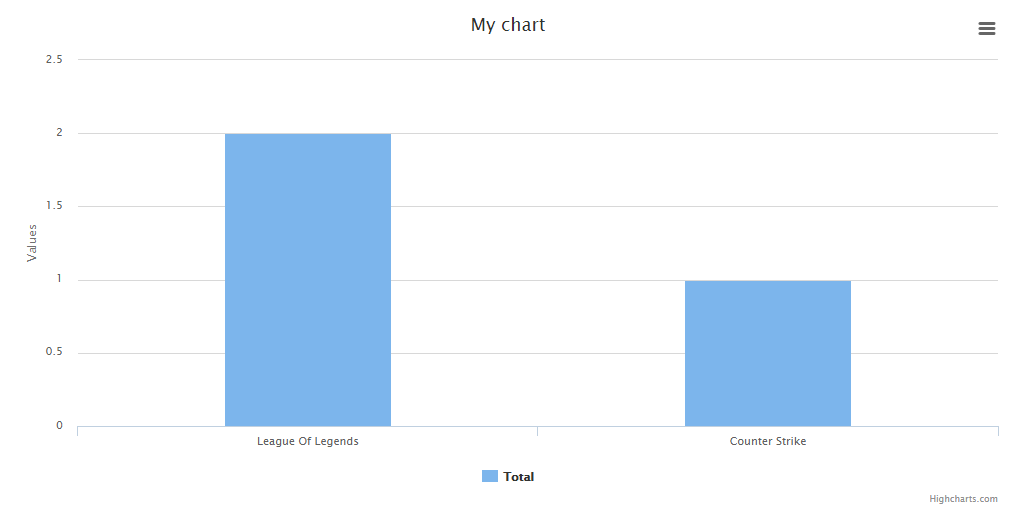
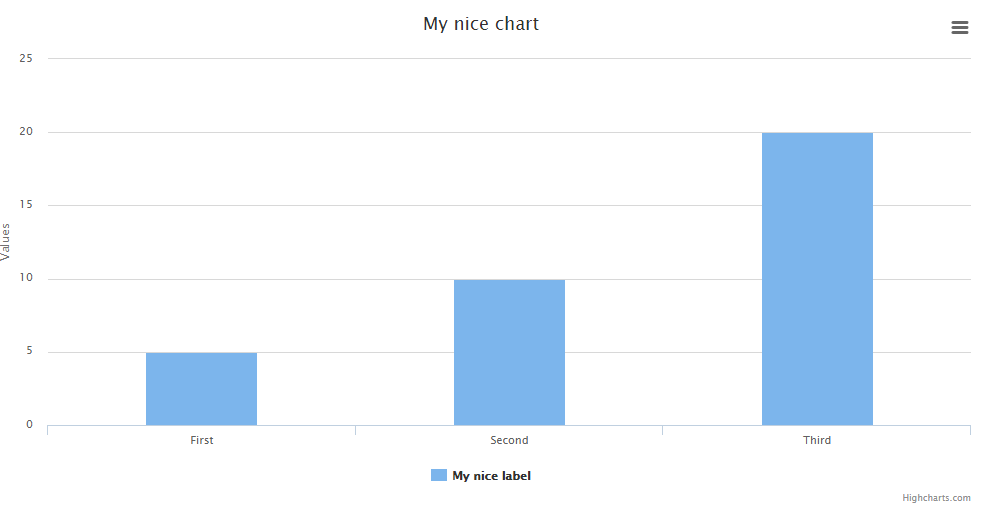
Bar
Note: can't change the color of this chart. Well it can but it's complicated, so I leave it here.
ColorBar
Note: not include element label legend.

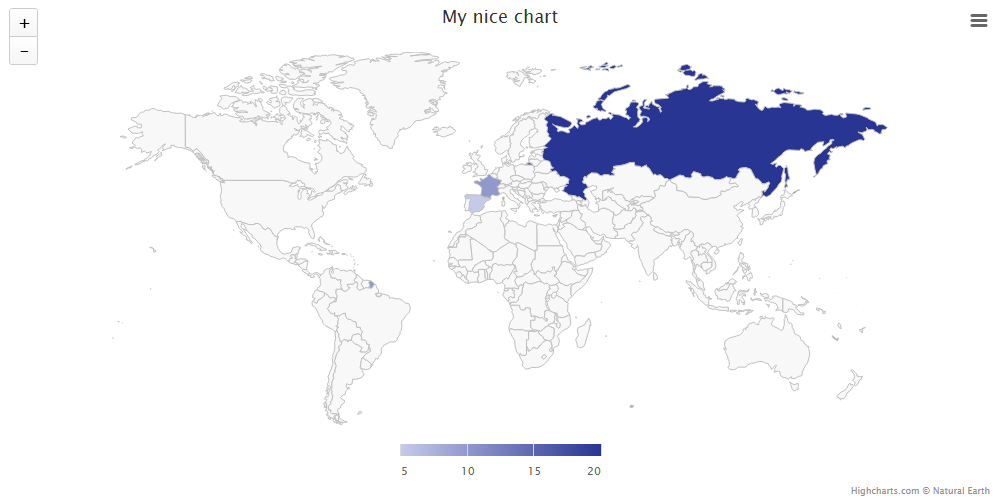
Geo
Note: The labels must have the country codes, not the name.
Note 2: To add color to the chart, you'll need to provide an array of at least 2 colors. The first is the min and the second the max.
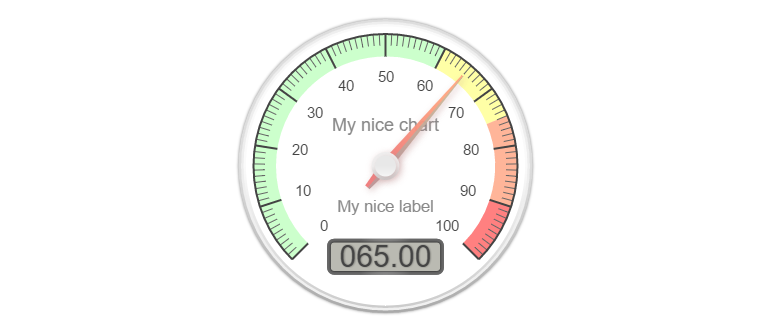
Gauge
Note: You either need 1 value or 3 following this standar:
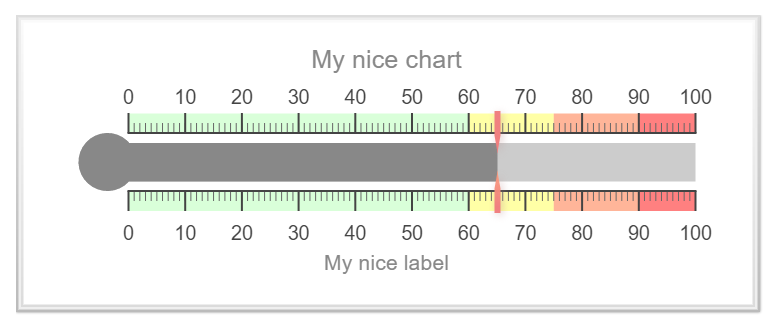
Temperature
Note: You either need 1 value or 3 following this standar:
Percentage
Note: You either need 1 value or 3 following this standar:
Progressbar
Note: You either need 1 value or 3 following this standar:

Extend your way!
You can create your own Charts by forking this repository. The folder contains all the current charts, but you can add yours like this:
Create a new file
Create a new file, the syntax is:
if your chart library is called: and your template is for the line chart: Then you create a file like this:
To call it later, just use:
You will need to add the CSS / JS to the includes.php file found in the folder.
You have plenty of examples to see how to put the data so just take a closer look at all the included templates before doing yours!