Download the PHP package ez-php/metrics without Composer
On this page you can find all versions of the php package ez-php/metrics. It is possible to download/install these versions without Composer. Possible dependencies are resolved automatically.
Download ez-php/metrics
More information about ez-php/metrics
Files in ez-php/metrics
Package metrics
Short Description Prometheus metrics endpoint for ez-php — Counter, Gauge, Histogram with a /metrics route and static Metrics facade.
License MIT
Homepage https://github.com/ez-php/metrics
FAQ
Example:
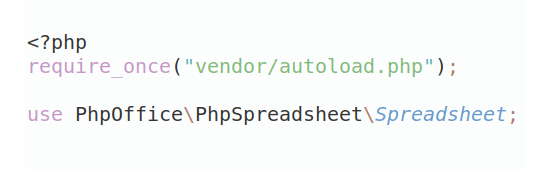
In general, it is recommended to use always a project to download your libraries. In an application normally there is more than one library needed.
- Some hosting areas are not accessible by a terminal or SSH. Then it is not possible to use Composer.
- To use Composer is sometimes complicated. Especially for beginners.
- Composer needs much resources. Sometimes they are not available on a simple webspace.
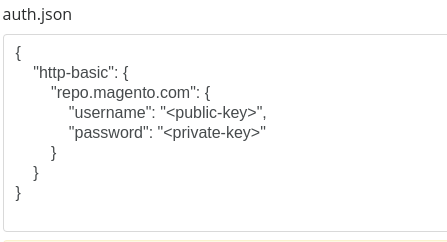
- If you are using private repositories you don't need to share your credentials. You can set up everything on our site and then you provide a simple download link to your team member.
- Simplify your Composer build process. Use our own command line tool to download the vendor folder as binary. This makes your build process faster and you don't need to expose your credentials for private repositories.
Informations about the package metrics
ez-php/metrics
Prometheus metrics endpoint for the ez-php framework.
Exposes a /metrics route in the Prometheus text exposition format.
Supports the three standard Prometheus metric types: Counter, Gauge, and Histogram.
Installation
Register the provider in provider/modules.php:
Usage
Counter — monotonically increasing
Gauge — current value (can increase or decrease)
Histogram — distributions and latency
Custom bucket boundaries:
HTTP request metrics
RequestMetricsMiddleware records http_requests_total and http_request_duration_seconds
for every request, labelled method, route and status. It is opt-in — register it as
global middleware and pass a route resolver so route is the matched route pattern
(/users/{id}), never the raw URI:
Unmatched requests (404/405) get route="unmatched"; without a resolver the route label is
left out. Status is grouped (2xx, 4xx, …) — pass exactStatus: true for exact codes.
/metrics endpoint
MetricsServiceProvider registers GET /metrics automatically. The response body is the full Prometheus text exposition format output:
Content-Type: text/plain; version=0.0.4; charset=utf-8
Sharing values between workers
By default values live in the PHP process — fine for long-running processes, but under PHP-FPM
every request starts from zero. Pick a shared storage in config/metrics.php:
metrics.storage |
Shared by | Requires |
|---|---|---|
memory (default) |
nothing — one process | — |
apcu |
the PHP-FPM workers of one host | ext-apcu (apc.enable_cli=1 for CLI) |
redis |
every host | ext-redis, metrics.redis.* |
Metric descriptions are stored too, so the /metrics request lists series that were only touched in
other requests. APCu stores values with 6 decimal places.
Security
The endpoint is unprotected by default, and the provider registers the route itself, so there is
no route definition of yours to add middleware to. To protect it, turn off auto-registration in
config/metrics.php and register the controller yourself:
metrics.endpoint also changes the path (default /metrics). Global middleware
($app->middleware(...)) works too, but applies to every route.
Relation to ez-php/health
| Module | Purpose |
|---|---|
ez-php/health |
Liveness check — is the service up? |
ez-php/metrics |
Time-series data — counters, gauges, histograms for alerting and dashboards |
Both are complementary production-observability tools.
HealthMetricsListener bridges the two directly, so a health check's status/latency shows up
as a metric without duplicating probe logic (requires ez-php/health — a soft dependency,
declared in require-dev here, install it separately):
Sets health_probe_status{probe="<name>"} (1=ok, 0.5=degraded, 0=unhealthy) and
health_probe_latency_ms{probe="<name>"} for every probe in $healthRegistry.
License
MIT