Download the PHP package debuggy/gauger without Composer

On this page you can find all versions of the php package debuggy/gauger. It is possible to download/install these versions without Composer. Possible dependencies are resolved automatically.

FAQ

After the download, you have to make one include require_once('vendor/autoload.php');. After that you have to import the classes with use statements.

Example:
If you use only one package a project is not needed. But if you use more then one package, without a project it is not possible to import the classes with use statements.

In general, it is recommended to use always a project to download your libraries. In an application normally there is more than one library needed.
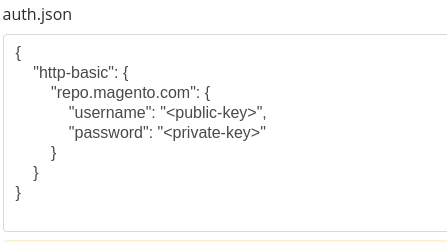
Some PHP packages are not free to download and because of that hosted in private repositories. In this case some credentials are needed to access such packages. Please use the auth.json textarea to insert credentials, if a package is coming from a private repository. You can look here for more information.

  • Some hosting areas are not accessible by a terminal or SSH. Then it is not possible to use Composer.
  • To use Composer is sometimes complicated. Especially for beginners.
  • Composer needs much resources. Sometimes they are not available on a simple webspace.
  • If you are using private repositories you don't need to share your credentials. You can set up everything on our site and then you provide a simple download link to your team member.
  • Simplify your Composer build process. Use our own command line tool to download the vendor folder as binary. This makes your build process faster and you don't need to expose your credentials for private repositories.
Please rate this library. Is it a good library?

Informations about the package gauger

Gauger

Build Status Coverage Status MIT / Apache2 License

Supported PHP versions: 5.6, 7.0, 7.1, 7.2 and hhvm It still should work under 5.3, 5.4 and 5.5, however those versions are not tested anymore.

License: MIT / Apache License, Version 2.0

What is Gauger?

This is a highly extensible and comprehensive tool for profiling PHP scripts and applications with no Xdebug or PHPDBG involved, so that you may even use it on prod if necessary, e.g. to find out why your script works slower than expected in the particular environment. Look at the examples and you'll see the main idea.

Goals of the project

The main goal of the project is to provide flexible and powerful abilities for profiling PHP applications. Moreover, a visual representation of harvested data is quite important as well as the minimal amount of boilerplate.

Contents

  1. Features
    1.1. Built-in
    1.2. Effortless
    1.3. Flexible
  2. Examples
  3. Installation
    3.1. Bootstrap
    3.2. Composer
    3.3. PSR-4, manual installation
  4. Documentation
    4.1. Comments in the source code
    4.2. UML
    4.3. This file
    4.3.1 Totals
    4.3.2 Timer
    4.3.3 Extra data
    4.3.4 Profiling without any overhead
    4.3.5 Subsections
    4.3.6 Postpone a report
    4.3.7 Refine data
    4.3.8 What is next?

Features

Built-in

Effortless

Flexible

Examples

There are several examples of the library usage in this file. Here is their list with links and short descriptions:

Installation

There are three possible ways to install the library.

Bootstrap

The easiest way is to include the project's bootstrap file GaugerBootstrap.php which will include the other parts of the library.

Composer

To install the library with Composer put the next code into your composer.json:

For more information about Composer visit its official site: https://getcomposer.org

PSR-4, manual installation

In this case you only need an autoloader compatible with PSR-4 standard. The library's package name (root namespace) is Debuggy which is in the directory src.

Documentation

There are three kinds of the project's documentation.

Comments in the source code

If you decide to fiddle with the library it'll be quite helpful to read the comments in the source code. It is fully covered with them. The main goal of these is one could understood the behaviour and implications of an entity by only reading its API and comments.

UML

All entities of the project are described with PlantUML. These files are in the directory uml/plantuml. PlantUML is an Open-Source UML generator. For more information visit its official site: http://plantuml.com

This file

The most essential concepts are explained here. It helps to look at the tool from the top and to start using it almost immediately.

Here is the list of the top layer entities:

Although there is a diagram of these entities, for start using the library we have to deal with the first two ones only. As mentioned, samples are shortcuts for some use cases. It means that as long as we have a classic scenario, we only have to choose one of the samples and use it.

There are four built-in samples:

Gauger is the static storage for samples, so that we can obtain them from every place of our code just calling its method getSample. The first argument is a user-defined unique key for the sample throughout an application, whereas the second is a sample's classname and has to be passed only once for each key.

Totals

Let's take a look at the simple example of using Totals sample:

The result might look like this:

On the left side of the report we can see the name of the stamp "Any name for the stamp". It's always the same identifier we pass in the method stamp. On the right side we can see two indicators: TotalDuration and MemoryPeak.

Timer

Another example shows Timer in use:

The result might look like this:

Here we have two parts of the report. The first one is called Stretchy and contains info about stretches. A stretch is a part of code enclosed between two stamps. If we look at our example source we'll see that there are two stretches: md5 and sha1. Each of them is a loop and is harvested three times.
The second part is called Summary and shows us calculated summary for each stamp:

Extra data

Each built-in sample contains an indicator that is invisible by default. However it'll be shown if we pass some extra data while making stamps. The indicator is called Extra and its only assignment is to keep any user-provided extra data that can be passed as the second argument in the method stamp.

Let's take a look at the next example:

The result shows us all unpredictable values:

Profiling without any overhead

There are two indicators to do profiling without the library's overhead: Extra and Preload. The easiest way is to use the sample Preload1 because it contains most of the boilerplate we need. However, even though it has almost all we need, it still might be necessary to choose some data representation format.

There are four built-in formatters:

The method Gauger::getSample takes the third argument as a list of arguments for a sample's constructor.
In the next example we will initialize the sample with custom data:

The result is gonna be something like that:

Subsections

Sometimes we have some sections of the source code that are folded into each other. It might be handy if we could profile those sections separately. There are two common cases how we want to do that: sometimes it is better to have info about inner sections subtracted from info about outer ones, whereas occasionally they shouldn't be split.

If we deal with stretches, we can make notes about folding of those in stamps' identifiers so that the library could calculate the data accordingly. The relations between stretches can be denoted in two ways:

The depth of a folding is unlimited. Let's imagine a method that makes a request to another server and we want to profile it:

The result will be something like that:

Here we can see that the time of the method itself is only 0.1 second, whereas the rpc part, that includes opening and closing sockets with an authorization and a query, takes the whole 3 seconds.

Postpone a report

Sometimes we don't want to see the report immediately. In these cases we could save sample's data somewhere and show it later. All samples make it possible through the method Sample::toArray. This method returns a php array that could be serialized and stored as a string (e.g., in a database). Later, when we want to look at the report we could take this array and use the method Presenter\Txt::represent: this is exactly what the method Sample::toString does.

Refine data

The only one sample implies possibility of filtering data: Timer. You can pass minimal and maximal values for stretches or their totals in the constructor. However, when it comes to data refining there are quite few predictable cases we can manage in the samples.
If you want to do your own refining of the data, you mostly have to make your own sample or just use all the parts of the library straightforwardly. There are several places in the project you should look at in these cases:

As we can see, there are two ways how we can filter stamps: Dial and Refiner. Lets take a look at the example of these components usage:

The result might look like that:

What is next?

If you want to have something more complex than the samples can do, you're welcome to look at the library sources. A very good place to begin is the samples. They are not only shortcuts but the samples how you can use the API of the library.

Please feel free to make pull-requests or issues if you know any ways to improve the library or this file (e.g., if you see any grammatical errors or can suggest any new sections for the documentation).

Moreover, you can find the UML diagrams of the project in the directory uml. A good one to start with is the diagram of the top level entities: gauger.pu

That's all. Good luck and have fun!


All versions of gauger with dependencies

PHP Build Version
Package Version
Requires php Version >=5.6
Composer command for our command line client (download client) This client runs in each environment. You don't need a specific PHP version etc. The first 20 API calls are free. Standard composer command

The package debuggy/gauger contains the following files

Loading the files please wait ....